Learn How One School Got 69% More Leads from Website Changes

Conversion Rate Optimization (CRO)! You’ve likely heard this hot marketing term but what is it? What can it do for you? We’re going to be breaking CRO down into easy to understand terms and talking about real strategies you can implement to increase leads on your website. We’ll be showing you the results of a CRO project we recently worked on with a client that resulted in a 69% increase in conversions on the homepage of their website.
Watch the Replay
What Is CRO?
Conversion Rate Optimization, or CRO, is the process of increasing the percentage of website visitors on your site that convert into leads or paying customers. In other words, get people to take the desired action on your website with the goal of that interaction resulting in profit for your business.
There is no magic number to aim for as far as conversion rates go.
Take others’ best practices and findings with a grain of salt. There is no lack of studies that say things like reducing the number of form fields on a landing page from 11 to 4 results in a 120% increase in conversions or that adding video to landing pages increase conversions by 86%.
The reality is, what works for one business may not work for another. Instead, think about CRO as an experiment that takes a lot of hard work and time, but that can definitely pay off if done correctly.
To find the conversion rate on your site, simply divide the number of transactions (desired action) during a given period of time by the number of people that visited your site during the same period of time, then multiply that number by 100.
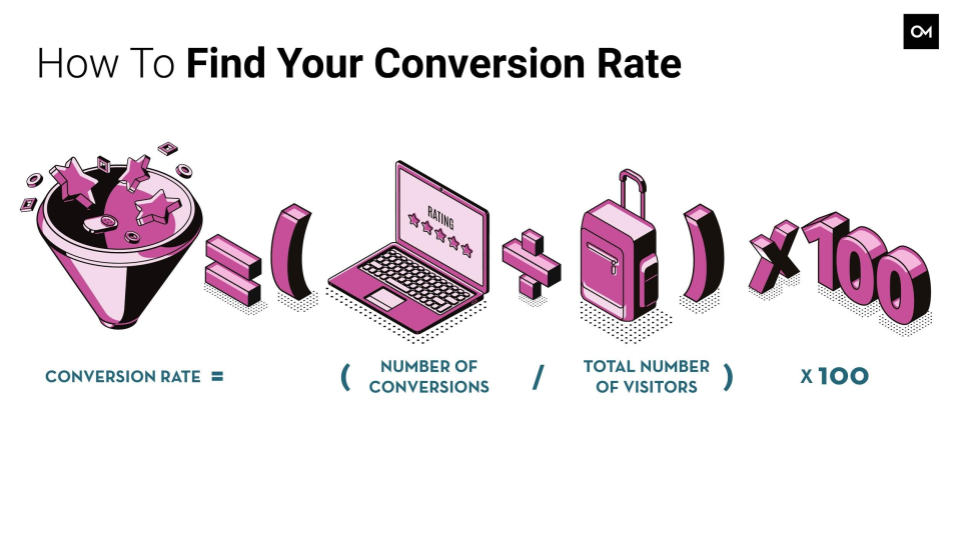
You’ll find the number of conversions on that page in a given period of time, for example 10 people filled out a lead form in 2020, and divide that by the total number of visitors to that page, 200 people land on the page in 2020.
10 Leads / 200 Page Visits x 100 = 5% Conversion Rate
If you double the leads on that page to 20, so 20 leads/200 visitors X 100 means you increase the conversion rate to 10%.
Once you’ve calculated your conversion rate, you have your starting point. It is important to know that there is no industry benchmark to reference when discussing conversion rates. Some businesses report a 1% conversion rate sitewide and others report 4%, most businesses do not report this data at all. For this reason, we recommend benchmarking against yourself. The most important part of CRO is determining what is and isn’t working for your specific audience.
Defining the Elements of CRO
Before we get into the steps of conducting a CRO experiment, let’s go over a few CRO-related definitions that are important to understand.
Call to Action (CTA)
Tells a user on your site what action you want them to take. A good CTA should convey value to the user without being overly salesy or spammy.
- Contact Us
- Make an Appointment
- Learn More
- Get More Information
- Book a Tour
Transactions
Refers to the action to be taken by the user when they click the CTA.
- Filling Out a Lead Form
- Purchasing a Product
- Signing Up for Emails
- Downloading a Guide
Heat Mapping
A tool used to record how users interact with your website. You can measure scrolls and clicks on a page, which can be very helpful in identifying where people are running into barriers instead of converting.
Analytics
Google Analytics is the platform that allows you to see, in detail, how people are using your site. It provides data on what pages are your most visited, how long a user stays on a page, bounce rate, how many people are converting on the page, and so much more.
Heat mapping goes hand-in-hand with Analytics, and you will need to be familiar with both in order to analyze your CRO data and make improvements to your website.
Conversion Funnel
Also referred to as the Marketing Funnel or Sales Funnel, this refers to the different stages of a person’s journey throughout the purchasing process.
Why Is CRO Important?
We know that more and more companies are conducting business online, and a website can make or break a business. So, optimizing your website to offer the best consumer experience possible is imperative. When you improve your conversion rate, you can acquire more leads with the same amount of traffic to your site.
CRO narrows in on specific actions users take, or don’t take, on your site. If you are putting in the effort to get traffic to your website, you want to make sure those visitors are finding the information they need and ultimately take action to get you leads. And, because marketing is an experiment and businesses must evolve to meet the changing needs of the customer, you will always have a place in the sales funnel where prospective customers fall off and do not convert. This is where it is important to understand drivers, barriers, and hooks.
| Drivers | What is bringing visitors to your site |
| Barriers | Where and why are users abandoning the site before converting |
| Hooks | What persuaded the user to convert |
Here’s an example.
You’re running a pay-per-click (PPC) campaign on Google Ads and are promoting a free guide that users can download on your website. This would be the driver.
Imagine that the user landed on the page the ad sent them to expecting to be able to download the guide but there was no clear CTA guiding them on how to do so. That would be a barrier.
Conversely, if that user landed on the page and immediately saw a button with a CTA that said ‘download your free guide’ that would be your hook.
What’s the Difference Between CRO and SEO?
The focus of this blog is CRO but it’s important to mention that the most effective lead generation strategy encompasses both Search Engine Optimization (SEO) and CRO.
SEO is what brings people to your website and CRO is what gets them to convert. While conversions may be your primary metric, you can’t convert people unless you get them to your site first. Any successful CRO strategy has to start with a strong SEO foundation.
Here are a few resources to get more information about SEO:
Setting Up Your CRO Experiment
Now that we know what CRO is, why it is important, and how to calculate yours, we can get into the steps of conducting your CRO experiment. The first thing you should do is outline your framework for the experiment. This involves:
- Choosing an objective – What are you testing?
- Testing your hypothesis – Your provable statement
- Measuring success – What metric will you measure to determine the experiment was successful or not?
Here’s a simple example:
- Objective – Increase the conversion rate on the home page.
- Hypothesis – If we make the home page form stand out more, we will increase conversions.
- Measure of success – We see an increased conversion rate on the home page.
We’ll discuss these pieces in more detail as we walk through the step-by-step guide to CRO.
A Step-by-Step Guide to CRO
We’ve laid the foundations for our CRO experiment, now we’ll get into a step-by-step guide that you can take with you and try for your business.
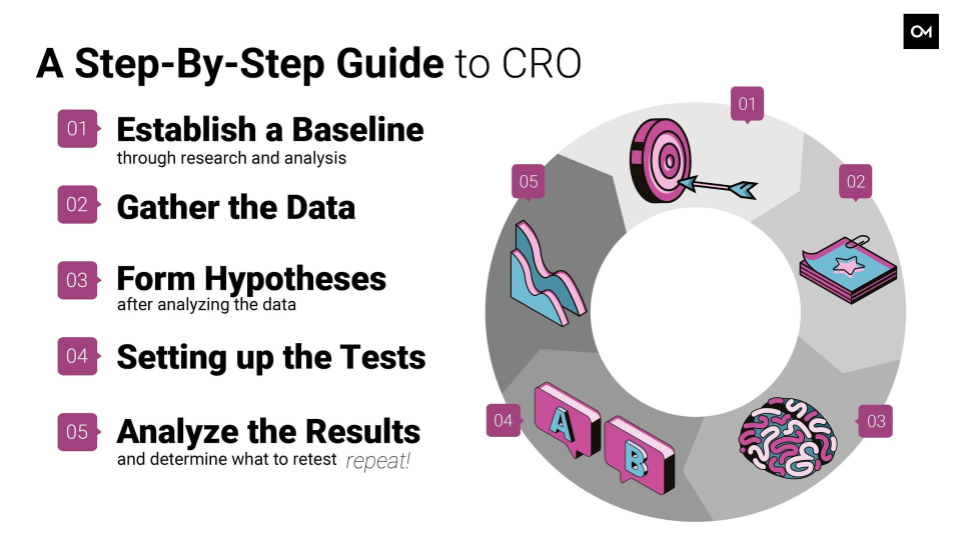
Step 1: Establish a Baseline Through Research and Analysis
We talk about this a lot at Oozle. The reason we have an audit and analysis phase for all new clients is that you don’t know where to go if you don’t know where you are starting. To determine your baseline:
- Identify your audience, how people are getting to your page, and what they are hoping to find there.
- This is where you can send our surveys or polls to your customers and let them tell you in their own words what the pain points are.
- Talk with the boots on the ground, like your admissions representatives or sales staff to understand the feedback and/or questions they are getting.
- Identify what pages are the most important/visited. Are they the pages you would expect? Is there a place for people to convert?
- Calculate your current conversion rate on the key pages identified.
Step 2: Gather Your Data
This involves installing a heat mapping tool on key pages. There are a variety of tools, some free, that you can use. We use a tool called Hotjar for our heat mapping, which we find is intuitive and free to use up to three pages and 10,000 views.
If you have a large website, a lot of monthly visitors, or would like data on more than three pages, a paid subscription would be necessary. Crazy Egg and Google Optimize are great tools as well.
The more data the better. We recommend running the heat mapping test for at least 3-4 months and enabling recordings, which will let you watch recordings of users interacting with the site.
You will also be collecting data from the survey that you distributed, if applicable, during this step.
Step 3: Analyze the Heat Mapping Data and Form Hypotheses
After letting the heat mapping run for a few months, you get to do the fun part! Analyze the data. In this step, you will come up with some hypotheses to test.
Think about your customer demographic and reference the results of the survey, as well as the heat mapping to identify areas of improvement. Some things to consider:
- Are people filling out the form on this page? If not, why? Some reasons could be that the expectation of what happens with their information isn’t clear. Or the form isn’t visible enough.
- Are users clicking CTA buttons? Why or why not? Is the CTA clear, is it compelling? Does the action offer value?
- Are people leaving the page before scrolling to important information? Is that information too far down the page? Is it not as important to the user as you thought?
When we were forming our hypotheses, we took into account the industry knowledge we had on high converting pages but also knew that what may work on one site may not work on another, so there is an element of guesswork.
Step 4: Set Up Your Tests
This step is where you will make changes to the website to prove or disprove your hypothesis. This could include changes like updated CTA verbiage, changing the appearance of a CTA, changing the flow of a page to put more valuable content above the fold, or any variety of other things that you believe are important to your users.
Step 5: Analyze Results and Determine What To Retest
After letting the second round of heat mapping run for a few months on the same pages you made changes to, analyze the results again and see if your changes had the intended effect on conversion rate.
If you don’t see an increase in conversion rate, not all is lost because you still learned something about your users, and that is always a good thing.
Conversion Rate Optimization is part research and part experiment. In our study, our hypotheses proved correct and we saw positive results, but that may not always be the case. It’s expected that there will be times you test something and find it decreased conversions. The good news is, you can revert your website back to its previous state and try again.
Our Experiment with AIMC
In our case study, we worked with one of our post-secondary institutions, Acupuncture and Integrative Medicine Berkeley (AIMC).
Step 1: Establish Your Baseline
To establish our baseline, the first thing we did was look at Google Analytics and identify three top-visited pages, all of which are an integral part of the prospective student research journey. We also worked closely with AIMC to gather feedback from their director of admissions on what the pain points were for those seeking information on the pages we wanted to test.
Step 2: Gather Your Data
After looking at how users were interacting with the site, there were three areas we wanted to test first to see if we could increase conversions:
- The home page form
- Mobile-responsive design
- Click-through rate to additional key pages from the MSOM page
We installed heat mapping on these pages and let it run for three months.
Step 3: Analyze Data and Form Hypotheses
Here were some of our key hypotheses we wanted to test after analyzing our heat mapping results:
- Increase conversion rate on the home page by making the form stand out.
- Increase mobile traffic by implementing a responsive site.
- Increase the number of visitors to each page through effective internal links/buttons.
Step 4: Set Up Your Tests
We made our recommendations to AIMC and got the approval to make the changes recommended. Then we ran our heat mapping again!
AIMC Results
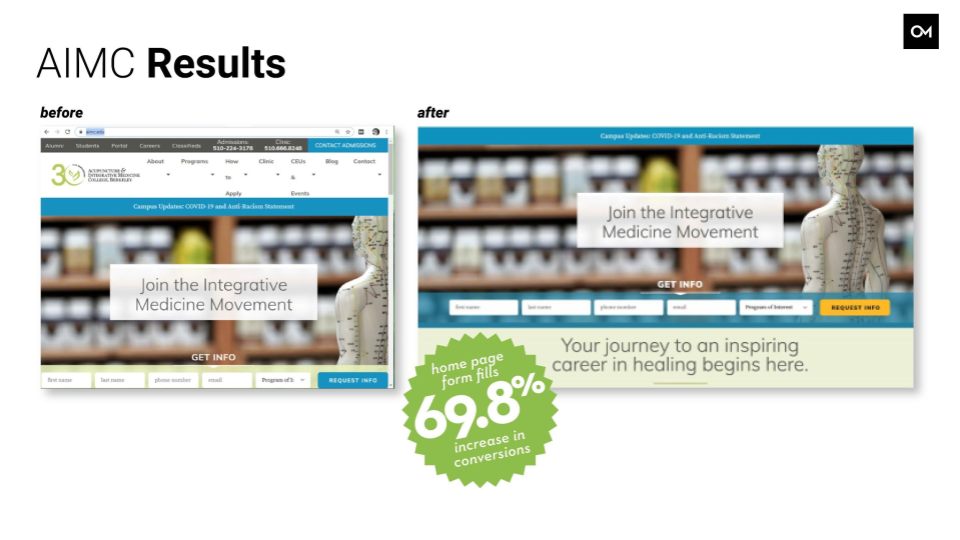
Home Page
On the home page form, we changed the color from green to blue, and changed the CTA button to yellow to stand out more. These changes resulted in a 69.8% increase in conversions (form fills).
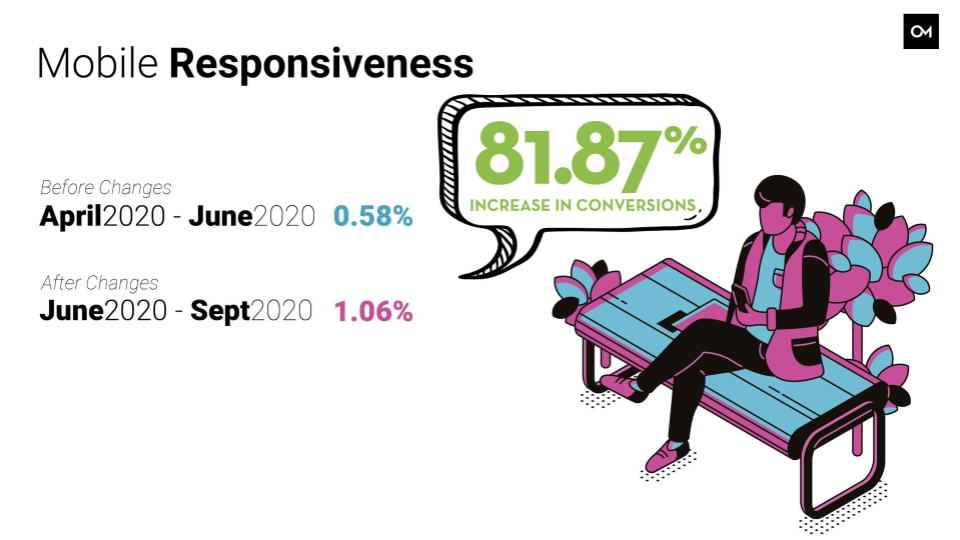
Mobile Conversions
We also optimized the site to be mobile-responsive, which resulted in an 81.87% increase in mobile conversions sitewide!
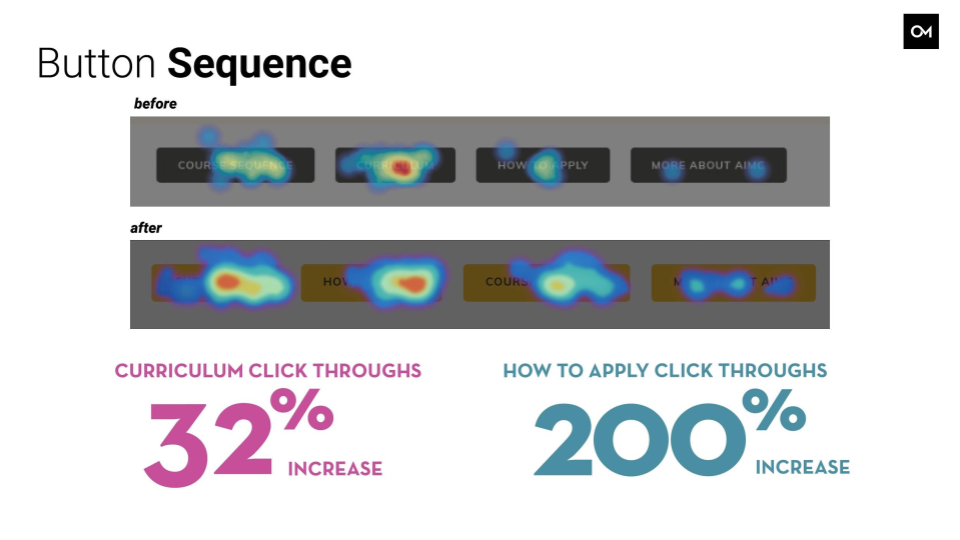
Order of Buttons on MSOM Page
Finally, we reordered the buttons on the MSOM page by order of what we expected to be most important information to prospective students. The goal was to increase click-throughs to key pages.
The initial button sequence was:
Course Sequence > Curriculum > How to Apply > More About AIMC
The buttons were reordered to:
Curriculum > How to Apply > Course Sequence > More About AIMC
Key Takeaways:
General CRO Best Practices:
- Be patient. Gathering data takes time but the more data collected, the more insight you will gain to make the right decisions. And know your results won’t always be what you expected and support your hypotheses, that is part of the learning process.
- Be specific with your hypothesis, goals, and objectives. Determine what your most important content and CTAs are on the site and focus there. There are endless opportunities to test on a website but the goal is to test the areas that will have the most impact on your business.
- Keep clear documentation (screenshots) and notes on what you are changing and testing. This is a very important step. The whole point of CRO is to test elements over time and make comparisons against your website performance. This is only possible if you have clear data on where you started and where you ended.
- Closely monitor your conversion rates over time. Nothing in marketing remains the same for long. Over the years your user demographics may change, technology may advance, or your goals and offerings may change. In fact, the average life of a website is now only 3 years! That is why we encourage you to revisit your conversion rates over time and take the time to continue to test and optimize your site as needed.
To recap, here are the steps we took in our CRO experiment with AIMC. Our hard work paid off and we increased conversions as we hoped. Not all experiments will be a success, but if you put the time and effort into CRO, you’re bound to see it pay off.
Let Oozle Media Help!
We hope you found this helpful and can take these tips back to your business and start thinking about your own experiments. Or, contact us to discuss how you can get a free website analysis and see how we can help you get more conversions!
Looking for more? Check out these resources: