The Budget Balance: How to Find the Right Google Ads Budget for Your School

David Steiner, Director of Paid Ads
Oozle Media
Video not loading? Click here to watch.
Chris Linford:
Ladies and gentlemen, there he is.
David Steiner:
Thank you for that introduction. And thanks everybody for joining my session today, I’m excited to talk to you about Google Ads budgets. So let me get my screen share going here. Hopefully, that is what you need, and I’ll get my notes back up. Okay here we are. So yeah, like I mentioned, going to talk about Google Ads budgets today. I know these can be a little bit tricky and scary sometimes, so I’m excited to get into all the considerations that need to be made when you’re looking at your Google Ads budgets. By a brief way of introduction… See if I can use the clicker here, there we go. This is my family. This picture on the left here is the most recent one. We just welcomed our second child, a daughter here three months ago. And last night, surprisingly, was actually probably the best night of sleep I’ve gotten in the last three months. So grateful for that.
Our Experience Working with Beauty Schools
As Chris mentioned, I’ve been working on Google Ads accounts with Oozle for, I think, seven years now and worked with hundreds of beauty schools across the nation. In doing so, we’ve noticed some patterns start to emerge from schools who are successful in their marketing efforts.
They tend to do things like
- engage with their agency, track their data, show up to their report’s calls, for example, and provide feedback to their agency.
- They think differently about their marketing budget and are willing to make the investment in marketing or they’re afraid to do so.
And that’s the differentiator that I want to talk about today. Successful schools know when you can spend a little bit more for that extra return. Sometimes at Oozle, we like to say that you got to spend money to make money. But these schools don’t just do it haphazardly or willy-nilly, right? These schools recognize that good data drives good business decisions and marketing decisions, and that following the numbers is usually better than following your feelings or fears when it comes to this sort of thing.
So like I said, that’s what we’re going to talk about today. Oh, now, the clicker is not working. There we go. But before we get into it, I just need to lay a little bit more groundwork context to provide. There are what I’ve put into two groups of factors that can influence your budget. The first group is this one here.
Influencing Factors on Marketing Budget
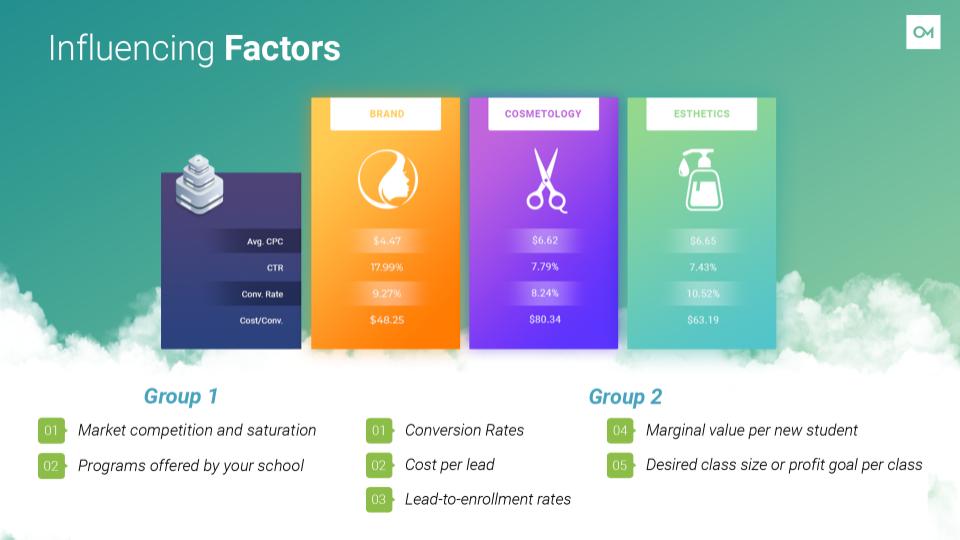
This is more or less what I presented on in last year’s summit. So if you didn’t catch that, I’m sure you can still find it somewhere. These are what I’m referring to as external factors. There are more or less environmental factors to be aware of. They can provide a starting place if you haven’t run ads before, or they can give you a baseline expectation of what you should see when you’re running ads for a particular program.
The second group of factors are what I’m thinking of as more internal factors, right? There’s a lot more complication with these. There’s a bit more push and pull with this group and your budget. If I’m being totally honest, when I was getting ready for this presentation and I was trying to prepare all this info, I kept finding myself getting really tangled up in this second group because they’re so interconnected, I found myself just going in circles. It’s really hard to talk about one of these things without simultaneously talking about the rest of them. So I’ve done my best to try to attack one of these at a time, we’re going to get into what each of these are and how they relate. But yeah, that’s the group of factors that we’re going over today, and that’s what makes up what is the balancing act that is finding the right budget on Google Ads.
Google Ads Budget and Cost Per Lead
So the first part of that balancing act is the relationship between your budget and a cost per lead. So cost per lead is defined as how much you pay on average for each one of your leads. Generally, it’s pretty straightforward. If you want to get more leads, you increase your budget. Right? We’ve all probably had that thought before. You’re looking to fill your next class, you increase your marketing investment.
Oftentimes, we’ve found that as you increase your budget, your cost per lead will go up. That is normal. It makes sense in an auction-based environment like Google Ads. The more budget that you give to the ad platform, the higher price that it’s going to be able to pay for clicks. It can bid a little bit more on that auction that makes it more competitive. It means that you’re getting better traffic and more qualified traffic. But on average that does mean that your cost per lead will go up a little bit and that can look or feel scary, but it’s totally normal and it makes sense. And we’re going to talk about that more.
This graph is the same thing. Conceptually, I’ve swapped out cost per lead for total lead volume, but it’s basically the same thing. As you increase your ad budget, you’ll likely see a diminishing return on leads. You’re not always going to see with each incremental increase in spend, the same increase in lead volume. Again, normal, just something to be aware of. You’ll probably have to experiment with increasing and decreasing your ad budget to see what that curve looks like for you and in your market, but that’s generally the first principle that we need to understand. So the relationship of budget and cost per lead in mind, we’re now ready to ask ourselves the next question. What is an acceptable cost per lead? Or if you’re looking at this graph, how high is too high on that curve when we’ve increased our budget?
So I think that there are two ways to determine an acceptable cost per lead, or sorry, two factors to determine that.
- They are the marginal profit of each enrollment that you get
- and the lead-to-enrollment ratio.
Marginal Profit
So we’ll talk about both of those, but we’re going to talk first about the marginal profit. So understanding this value is going to help you work backwards. You’re basically going to take that value and spread it across how many leads you need to get that enrollment and figure out that value. But the tricky thing with this is that the marginal value or the marginal profit of each enrollment is not always the same, it tends to move. Every class has a fixed cost associated with it, right?
- You have to pay your instructor
- you have to pay for the equipment
- you have to pay for the utilities in your building
- your administrative costs, etc.
But once you generate enough revenue from your first few students to cover that cost, the value, the profit that you make off of your next subsequent students or the profit that you make on them, like I said, jumps up dramatically. Right?
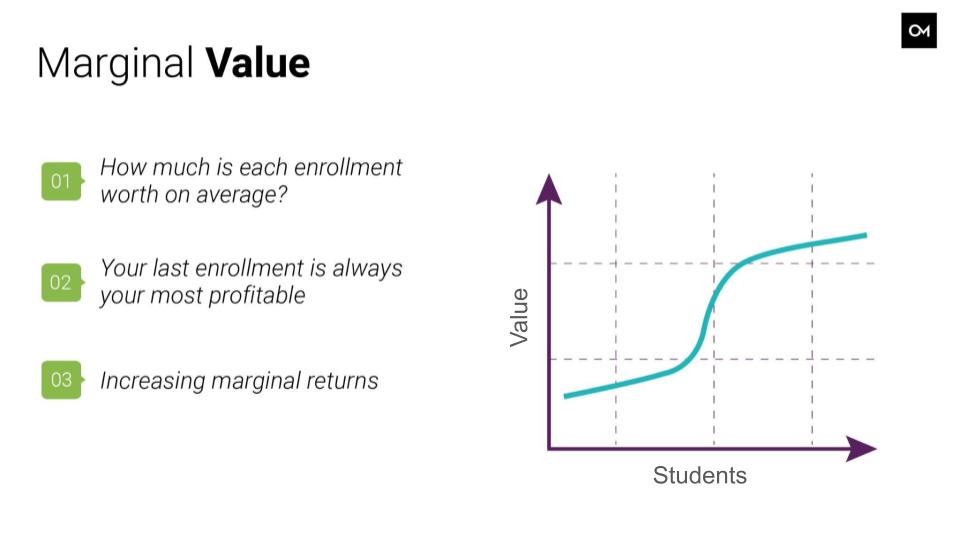
That’s why this graph looks like a steep S curve here. Maybe the bottom end is the value of the students before you hit that threshold and the top end is the value of the students after you’ve covered your fixed costs. So, because the profit that you make from those later students is much higher than the profit that you make off of the earlier students, in theory, you should be willing to spend more or invest more in your marketing budget to get those students on that second half, the last students that are filling the last seats in your class. And as long as the investment is less than the profit value that you make from that student, you’re still walking away with a positive return on your investment. So you can do this on a per enrollment basis. In theory, each enrollment has a different marginal profit that you’re walking away with, but more than likely you can work with averages. Maybe you just do two averages at a low average and a high average depending on where you are on that curve.
How Much Should a Lead Cost?
But with that average profit, you can then, like I said, divide that across the leads. You need to get a single enrollment to find an acceptable cost per lead. If you don’t know these numbers for your school, I highly recommend trying to figure them out. You need to be asking yourself questions about what are the fixed costs associated with a single class? How many students do you need to cover that cost? And then after what number of enrollment is there just pure profit with each enrollment and then what is the value of that profit or what is it on average, like I said? And then the last thing is how many students can you fit in a class or what’s your profit goal per class? Because it doesn’t make any sense to invest a lot of money in another enrollment that maybe doesn’t fit into that class.
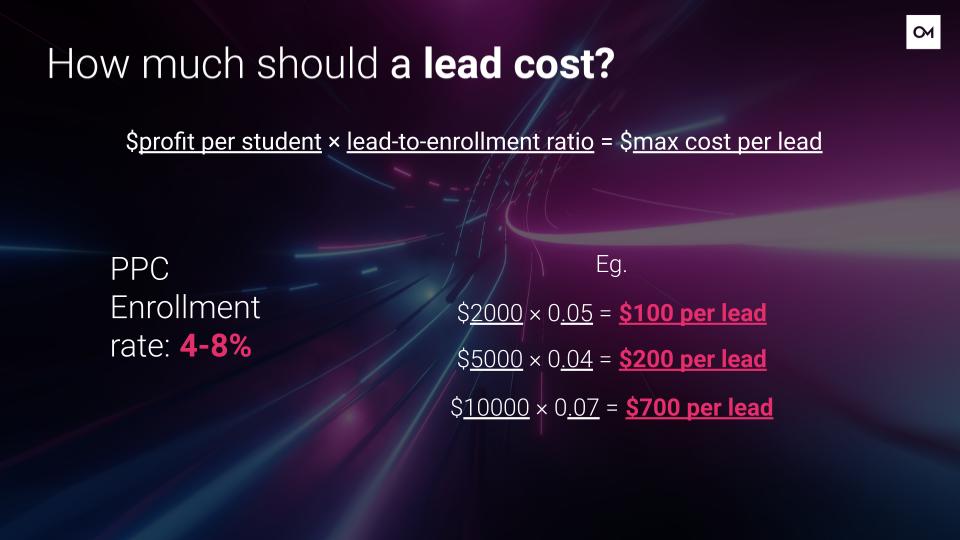
So like I said, we can use this marginal profit now to find an acceptable cost per lead by multiplying it… Oh, I clicked away again. There we go. By the lead to enrollment ratio. So a lead to enrollment ratio is the rate at which your leads enroll. It’s usually represented at a percentage. We have, like I said, worked with so many schools that we found the average of lead to enrollment on PPC with the schools that we work with. You can use that range. It falls usually between four and 8%. My slide isn’t working. There we go. So that’s typically the average for PPC. If you want to use this as a starting point, feel free. Just know that the better data you have, the better decisions that you can make for your own school.
Achieving Budget Balance
So now, I’m going to go over a couple of examples with this just so that you can get a sense of what this is supposed to look like. So I’m just going to make up the numbers for the profit per student, and then I’m going to use a few different rates here for the PPC enrollment. But let’s say that you know the profit you’re going to make off of your next enrollment is $2,000. If you multiply that value by your lead to enrollment ratio, I’m just going to use 5% because in this range here, you’ll find that the maximum cost per lead is $100. That’s the highest allowable cost per lead you should accept until you’ve enrolled that student. Anything over $100 and you won’t make any money back or you won’t make the money back that you’ve invested into the leads. But as long as your cost per lead is below that mark, then you’re making a positive return on your investment.
I didn’t include this example in here. But if we just change, for illustrative purposes, the lead to enrollment ratio from 5% to 7%, that then gives you $140 cost per lead to work with. So just know that the higher your enrollment ratio is, the more valuable your leads are going to be on average because you’re not spreading that profit across quite as many leads.
So the next example, let’s just say the profit that you know you’re going to make from your next enrollment is $5,000. Let’s say your school is getting a 4% enrollment rate on PPC, you multiply those numbers together and $200 is your maximum allowable cost per lead for that next enrollment. And then last example. Let’s say this is your flagship cosmetology class, and this is the last seat that you’re trying to fill for that class. You’ve got a pretty high enrollment rate for it, it’s 7%. You multiply those two numbers together 10,000 by 7%, it gives you a $700 maximum allowable cost per lead.
So looking at those numbers, I would bet some of them are a little bit higher, maybe a lot higher than you might have guessed or expected if you hadn’t done the math. But it’s good to know, I think, that a $400 cost per lead, $500 cost per lead in the right circumstances is still well below the limit for making a profit off of that enrollment.
So now, you basically have the information that you need to find the right balance for your budget, right? You know that if you increase your budget, you’ll likely see a increase in cost per lead. But you know that that’s okay because you know how much each enrollment is worth and you’ve done the math to find out what your maximum allowable cost per lead is.
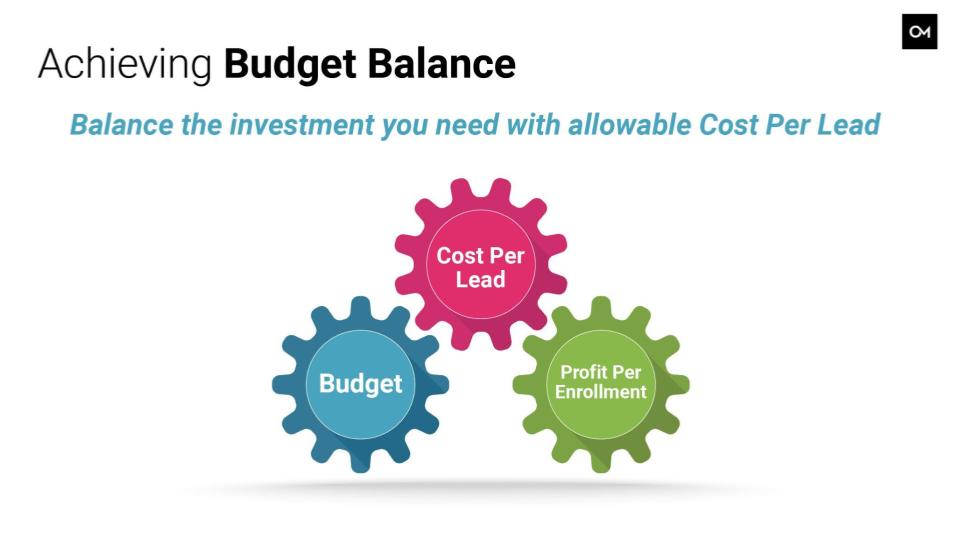
So that is how all of these factors influence each other and balance each other out. Like I said, you have the relationship between marginal profit per enrollment, acceptable cost per lead, and your total budget.
As your marginal profit increases, that affects your cost per lead.
It allows it to be higher and it gives you more room to increase your budget and generate more leads. Going in reverse, if you increase your budget too much, your cost per lead might get out of range and get too high, and then you’ll have to bring the budget back down. And that’s why I’m referring to this all as a balancing act, right? So now, that we’ve got that theory in mind, hopefully understood, hopefully I made that clear enough, I want to give you a sample scenario of what that could look like to apply that knowledge in the real world. So let’s say you’re getting ready for your next class start. You’ve got a few seats left in your next class that you want to fill, and since how much they’re worth or how valuable they are to you in profit, you also know how much you’re willing to invest in each lead to get them.
So you increase your ad budget a little bit as the start date gets closer and you know it’s still profitable to spend a little bit more for those last few seats as long as your cost per lead stays below that threshold that we’ve calculated. And then your next class starts, let’s say that’s represented by these arrows here as a class starts. And perhaps you have a wait list, you have some leads in your database you’re still working, you can bring that budget back down so that you’re not investing as heavily in the leads that aren’t as valuable to you and see how things go until that class start gets a little bit closer. Then let’s say you’ve passed that threshold. The class is now paid for itself and you want to get the last few leads, you can ramp up your budget a little bit more to fill that class until it starts again. And then basically rinse and repeat, right?
Class starts again, lower that budget, let it fill up, etc. That being said, you don’t want to fluctuate too much. I had a graph that had higher peaks and lower values than this, but I tried to smooth it out a little because obviously you don’t want to be going from zero to a million back and forth in Google all the time. But that was just sort of an example I thought that could be useful in the real world.
Now, that we’ve applied this knowledge, there are some additional nuances to consider if you want to take it one step further. Not every lead is going to enroll in the next start date, right? But they will be in your database, your admissions team can continue to work those leads and often they’ll start at a later date. Seasonality is another factor to consider. It sort of relates to this first point. We know that, generally, the new year and back to school is when we typically see the most interest, that’s when we generate an outsize number of leads. And we often say at Oozle that you should fish while the fishing is good. That’s good too because usually the cost per lead is lower at that time, and those leads can get into your database, and you can continue to work them for the future.
Making Decisions Based on Data
If you look at and analyze your data on a pretty granular basis, you can get really specific with this. If you know that the lead to enrollment rate or the marginal profit value is different by program or by campus, you can come up with a different acceptable cost per lead or cost per lead limit for each program, or campus, or both. And then you can maximize that investment based on each of those things. I know that can get complicated, but working with someone, an agency like Oozle can help you analyze that data. We’ve helped schools figure out their data before, look at their lead to enrollment rates. It does require that you’re willing to be transparent with your agency and share things like your enrollment data, but in my opinion, it’s worth it. Understanding, because if you understand when an increased cost is still positively affecting your profit, it can give you a competitive edge as a beauty school owner.
But again, it does require that you think like a business. Basically, you recognize that spending a dollar amount that can feel scary. With the right math, you can make a calculated decision and be confident that you’re still going to come out with a positive return. So let the math determine your budget over your fears. So that pretty much wraps it up for me. I’d like to put this slide at the end of my presentations like Parker mentioned earlier as well. If you’re ready to get into the nitty-gritty or down and dirty with your data, reach out to me. This is my email address, I’m happy to chat to you about it.
We also do audits on existing accounts, we call them x-rays. But if you have an account that you would help looking at and want to identify possible issues or maybe room for improvement or growth, hit us up. Send me an email. We’d be happy to take a look at it and go over that with you. I think I’ve got a few minutes left, so I’m going to open up the chat and see if there were any questions in there. Otherwise, I would turn it over to Chris.
Chris Linford:
Yeah, Steiner. If you have questions… Oh, it looks like we do.
David Steiner:
Yeah, I see-
Chris Linford:
Is there that we can hire to come in and figure this out for us.
David Steiner:
Basically, yes.
Chris Linford:
Love, Natalie. Yeah. Which platform are you finding the most effective for advertising? Is it Google Ads, Meta, TikTok? That sounds like a great question for our marketing panel.
David Steiner:
Right. That’s true.
Chris Linford:
But if you want to give a little snippet to that.
David Steiner:
Yeah, what sounds like a cheap answer is I think the truest answer is that they’re all important. They all play different roles, and they interconnect and play together. You’re going to get different results from each one, but that doesn’t mean they’re not also affecting each other in the overall picture. So hopefully, that’s a little preface to what we might talk about in the panel later this afternoon.
Chris Linford:
What about enrollment rates, right? So Google Ads and then social ads. I know you had obsession on this last year, was it last year or year before? In terms of enrollment rates, which ones enroll at a higher rate from Google, from social media? What are you finding in the data?
David Steiner:
So I’m biased. I like Google Ads, but we found that organic, typically has a higher enrollment rate because you’re getting those students that are trying to find you. Google Ads has the next highest enrollment rate because you’re paying to get in front of them. They’re still interested. They’re making the effort to type out a physical search query that they’re interested in your school. So they’re still super relevant, just slightly less than organic. And then I think social comes in just behind that as well, because the nature of social is that you’re interrupting their entertainment, usually. They’re scrolling on Instagram, they’re looking at Facebook and you’re interrupting what they’re doing to tell you about your school. So it’s just a little bit different flavor for each one. But like I said, they’re all important. I think in general, that people who see your ad on Facebook are going to know you more and search you later and maybe come in. And those are really the higher converters in on organic, for example. So they all play their part.
Chris Linford:
We’ve got a question from Vince. It says, “Do you get most of your data through reporting on the CRM or through a third-party software? Or can Oozle provide all the data?”
David Steiner:
Yeah. So Parker’s answer, I see he just chimed in is really good. It takes a little bit of work, but it’s kind of a mix. On Google’s platform, we generally just see what we’re tracking as a conversion. Typically, that’s a lead form submission. But with client feedback and when we’re doing reports, we get a quite bit more, what’s the word I’m looking for? Pure with that. We scrub that for duplicates, and spam, and stuff like that.
Chris Linford:
So going back to your presentation, I mean, it may be hard to kind of really understand. It’s like, “Okay.” Like “At what point have I enrolled enough in a future start? I’ve covered all of my overhead expenses, I’ve got capacity for X amount of more students. I’m willing to pay more for those leads because I’ll make more and profit on them.” And working with schools who have accurate data, and you can get to that point, is it a game changer for them? What have you noticed with these schools and the feedback, and even your campaigns and the results?
David Steiner:
I would say that a lot of times, I think, what happens is people who are investing in their marketing start to see where that diminishing return comes. They increase their budget, they get more leads, they feel good. They increase their budget again and they don’t get quite as many leads in addition as they did last time. And so they’re like, “Oh, okay. We found the sweet spot. We can’t go any higher.” What I’m trying to explain is that that’s not necessarily always true, right? The most valuable leads can be the most expensive, but you still make a profit on them if you are careful with the way you’re doing it.
Chris Linford:
Right. And I would imagine, sometimes some schools say, “Oh, well, I’m running Google Ads. It’s kind of a set it and forget it.” But if you want to get to this level, you’ve got to be in your data. You’ve got to be communicating with whoever your in-house person is, your agency. You really got to know these numbers. And I would imagine there’s a lot of work in the beginning, but how often are you communicating with clients during these times? Like, “Hey…” Increased budget, seasonality, all the things that you mentioned.
David Steiner:
I would say generally, not as often as we are willing to. By that, I mean, that clients aren’t as usually as willing to come with us and collaborate. We are often looking for that feedback and collaboration. Like I mentioned, in the platform, we can only see leads. But if you have data in your CRM or you know who’s coming to a tour or coming to start, that gives us better feedback and we can work with that and make better decisions.
Chris Linford:
Awesome. Steiner, you’re awesome, man. Really good presentation. We’ve had people request the slides. We’re going to be sending that out recordings to this after the summit. But Parker, maybe throw Steiner’s email in the chat one more time for people who may have further questions. I’m pretty sure you can get to the point where you can lead people in the right direction as far as where to look for data, how to get their numbers. So Steiner, thanks man. We appreciate it.
David Steiner:
Yeah, thank you.
Chris Linford:
Okay. We’re just going to move right into our next session. We’re excited-