Beauty Schools and Google Search Ads
David Steiner
Director Of Paid Ads, Oozle Media
Beauty Schools and Google Search Ads
Chris Linford: Hey, take it away.
David Steiner:
All right, well sweet. Thank you. Hopefully you can see my screen. Let me know if you can’t. But yeah, as Chris said, I’m Dave. Thank you so much for attending this session today. I’ve got a lot of stuff that I want to talk about, and hopefully some things that are helpful to you in your beauty school business on Google Search ads. So like I said, I’ve got a lot to cover, and I’ll just kind of jump right in.
Let’s see the clicker. Here we go. Okay, so first things, first, couple of cute photos of my family. Because honestly when they’re that cute, you’re kind of obligated to share them. But as Chris said, I’m Dave, the director of the Oozle Media’s paid ads team. I’ve got several years of Google Ads experience at Oozle Media with beauty schools on Google search.
So we’ve been doing it for a long time with a lot of schools across the country. We consider ourselves to be a leader in this industry. As such, we try to put together every year industry benchmarks for just aggregate trends so that we can keep track on how the market is going, how things are doing. So that’s what I did this year, and that’s kind of what I’m going to present on. So we put together some key metrics for over $4 million in ad spend, and that’s what I’m going to share.
If you haven’t run Google Ads in the past, I’m hoping this can give you an idea of maybe what you can expect, if that’s an investment that you’re looking to make. Or if you have run Google Ads already, maybe this gives you sort of an idea of where you match up. How you can measure yourself against the competition, or against the market market generally.
So the caveat being these are, again, just averages. So not everybody’s going to look like this, and we’ll get into it in a bit later. But it’s okay if your performance doesn’t look like this, as long as you know why. But we’ll talk about that in just a moment.
Benchmarks By Inventory Type
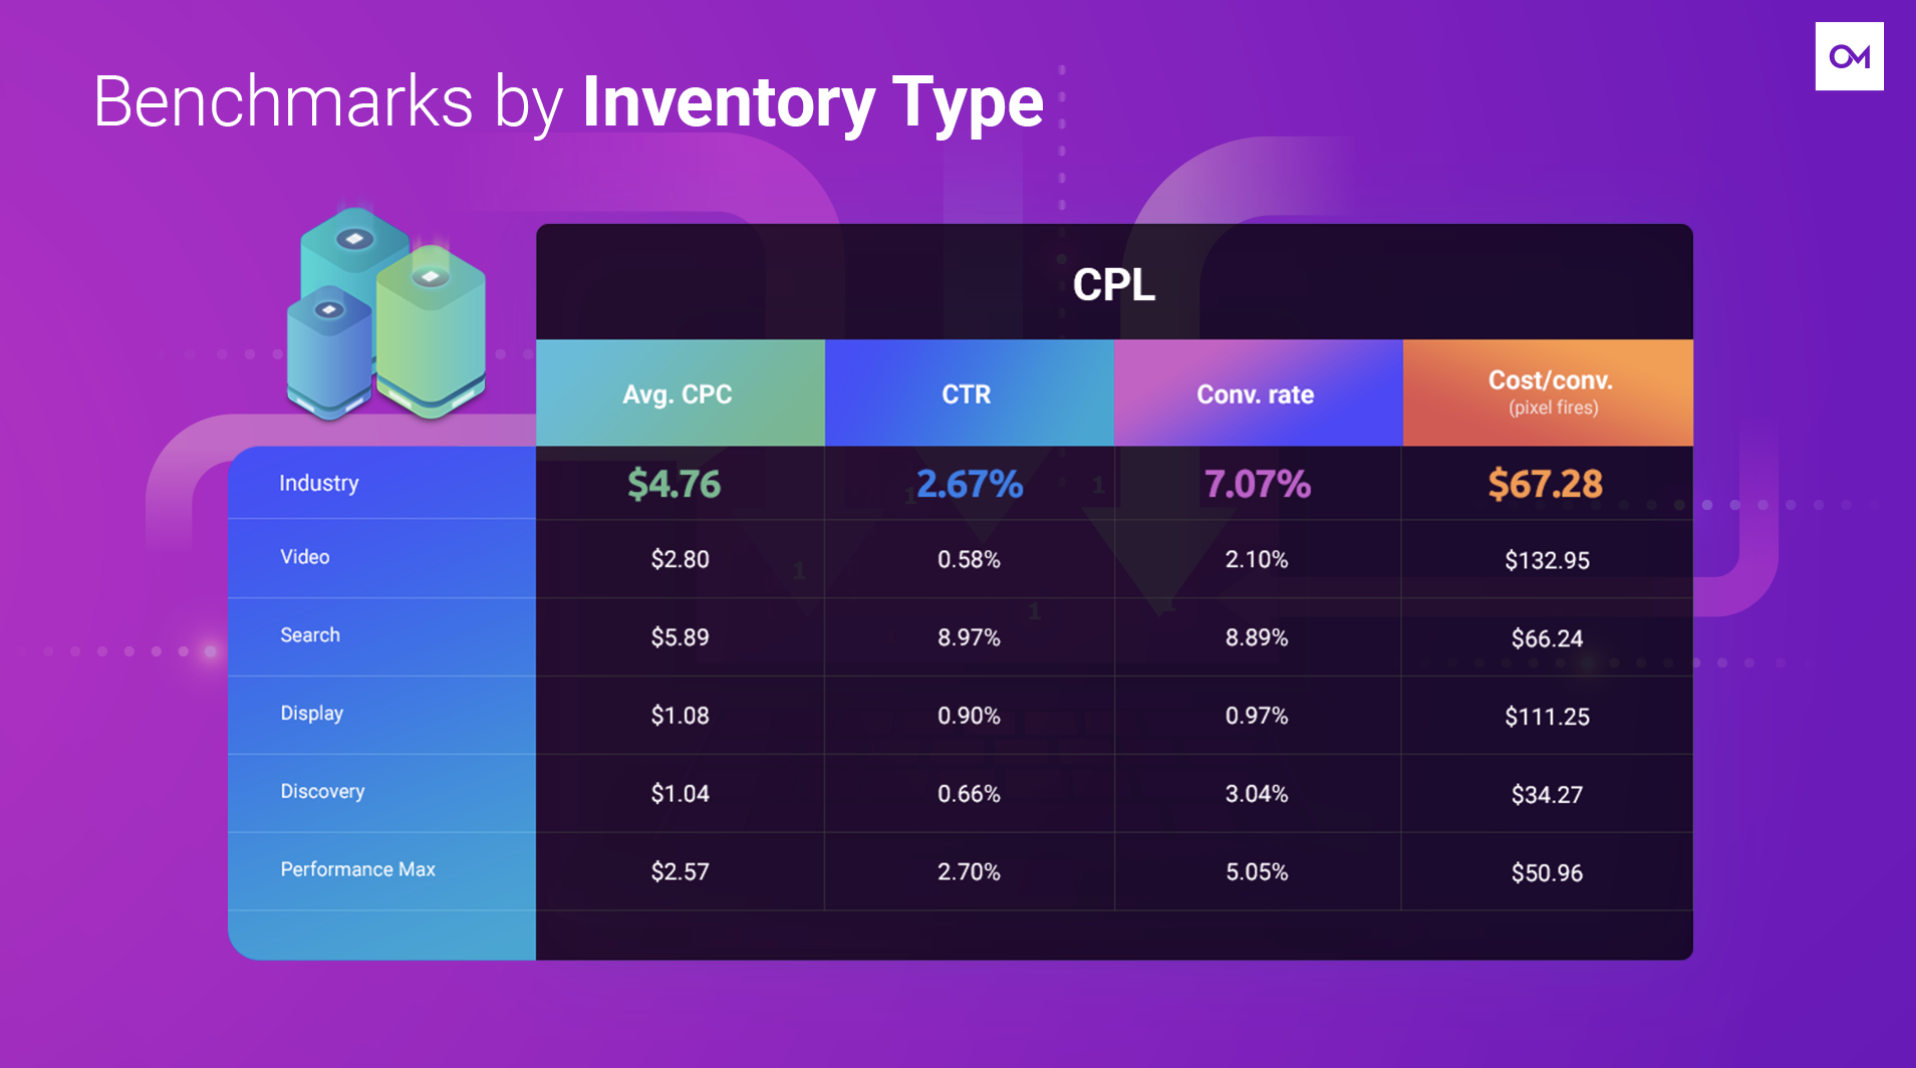
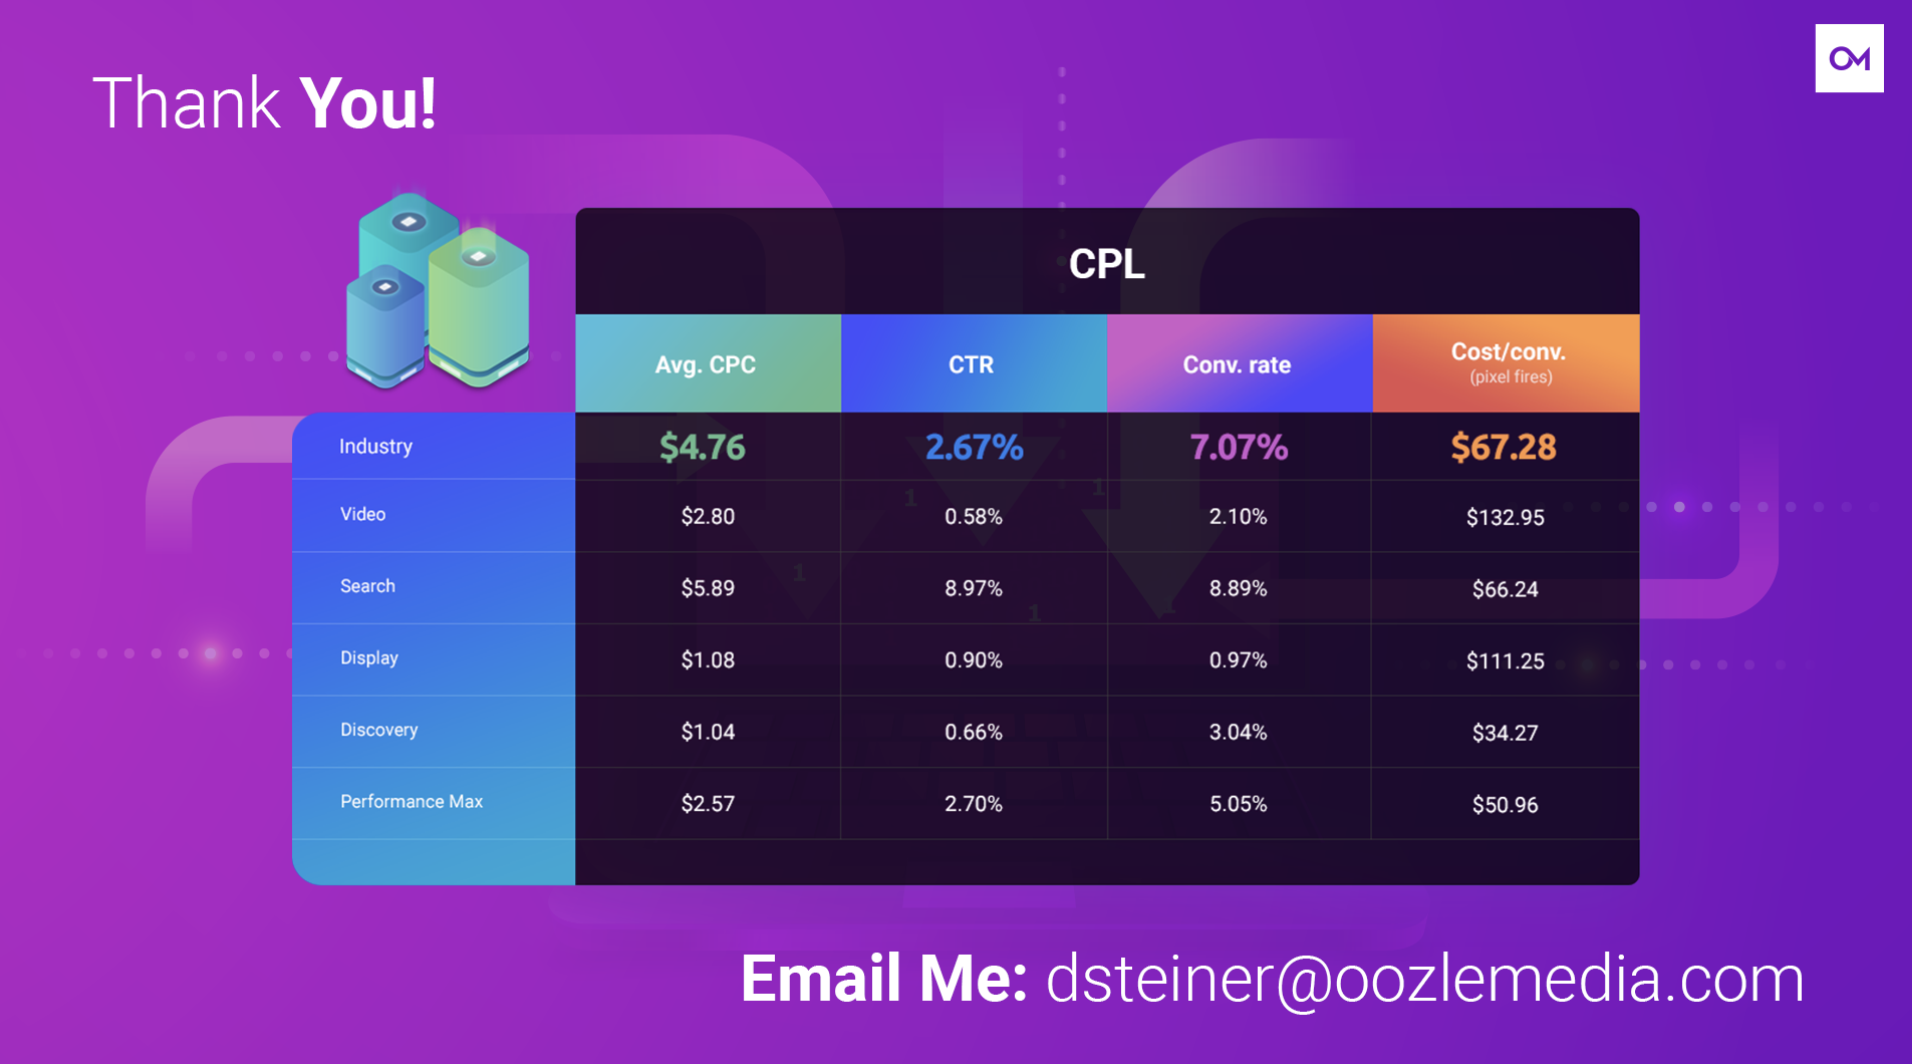
Okay, so diving right in. Here is the benchmarks by inventory type across the board. This is basically the top-level data. So go ahead and take your screenshot if you want, of this data here. And as we go through it, I just want to define some of the terms.
So moving right to left across the top we’ve got average CPC, stands for cost per click. So that just means generally, on average how much it costs for someone to click on your ad. CTR stands for a click-through rate. So that means out of how many times your ad shows, the percentage of those impressions, it’s called get a click. So how often your ad gets clicked over how many impressions it shows.
Conversion rate is just one step further, what ratio of those clicks then turn into leads. And then lastly, your conversion. Cost per-conversion is pretty self-explanatory. One note on this though, is this is being based off of pixel fires and ad budget. So if you’re a client of ours, you may get in your reports that we don’t really report on pixel fires per-se. We report on names in your lead forms. We try to make sure that those match as closely as possible, but there’s always some discrepancy. This is referring to the pixel fires. And it’s, like I said, referring to your ad budget. Nothing to do with whatever admin fee you may be paying. So this is just platform spend.
So with that note, these are the different sort of inventory types or campaign types that we can run, and how they stack up, so you can decide maybe where is the most efficient place to put your money. As you’ll notice, display and video, we sort of think of those as upper funnel tactics. So demand generation, brand awareness, those have the highest cost per-lead. That makes sense because the goal for those campaign types isn’t necessarily to drive conversions, at least not directly. It’s to generate demand around your brand.
Search is where we find the traffic is most, it’s like the most bottom of the funnel, that has the highest intent to convert. So that’s where you’re going to see the best performance across the board. If you’re limited by budget, that’s where we recommend starting your ad strategies. The cost per-lead is pretty good. The clickthrough rate and conversion rates are really high. When it comes to these other two discovery and performance max campaigns, they’re kind of in their own world. They’re outside of what I would consider the marketing funnel. Discovery is kind of like Google’s social media ad in a sense. So it’s for, anyone who’s on an Android device, they have a discover page. And discover ads show up in that feed, much like a social ad would in a social feed.
Performance Max is kind of the newest maybe, toy I guess from Google. This one is presented as a compliment to your search ads. So it’s not meant to be run by itself, at least not yet anyway. But the inventory that it serves on is basically everything. It can serve in videos, it can serve in search, display, Gmail. It can serve in Discovery as well. So it looks like that one gets a really good cost per-conversion. Well, it does get a good cost per conversion. But I guess the caveat to it is that because its goal is just get as many conversions as humanly possible, or I guess machine possible, the quality of those conversions isn’t always the best.
It’s a little bit questionable. So we have seen this work if you’re able to put tight parameters on it, this campaign type can do what it says, it can perform. But we just sort of advise that one with caution. And again, only as a compliment or an aggregate to your search campaigns, so not in lieu of those.
So that is a high-level overview of the sort of industry benchmarks by campaign type or by inventory type. What this does not address though, is the different programs that you’re advertising. We found that the performance varies a lot based on the program that you’re trying to advertise for.
Benchmarks By Beauty Programs
So that’s what I’ve done next. I’ve broken it down by programs, and this is all just on search. I decided to focus on that inventory type because that’s the one that basically gives the best return.
Barber, Lash, Makeup, and Massage Benchmarks
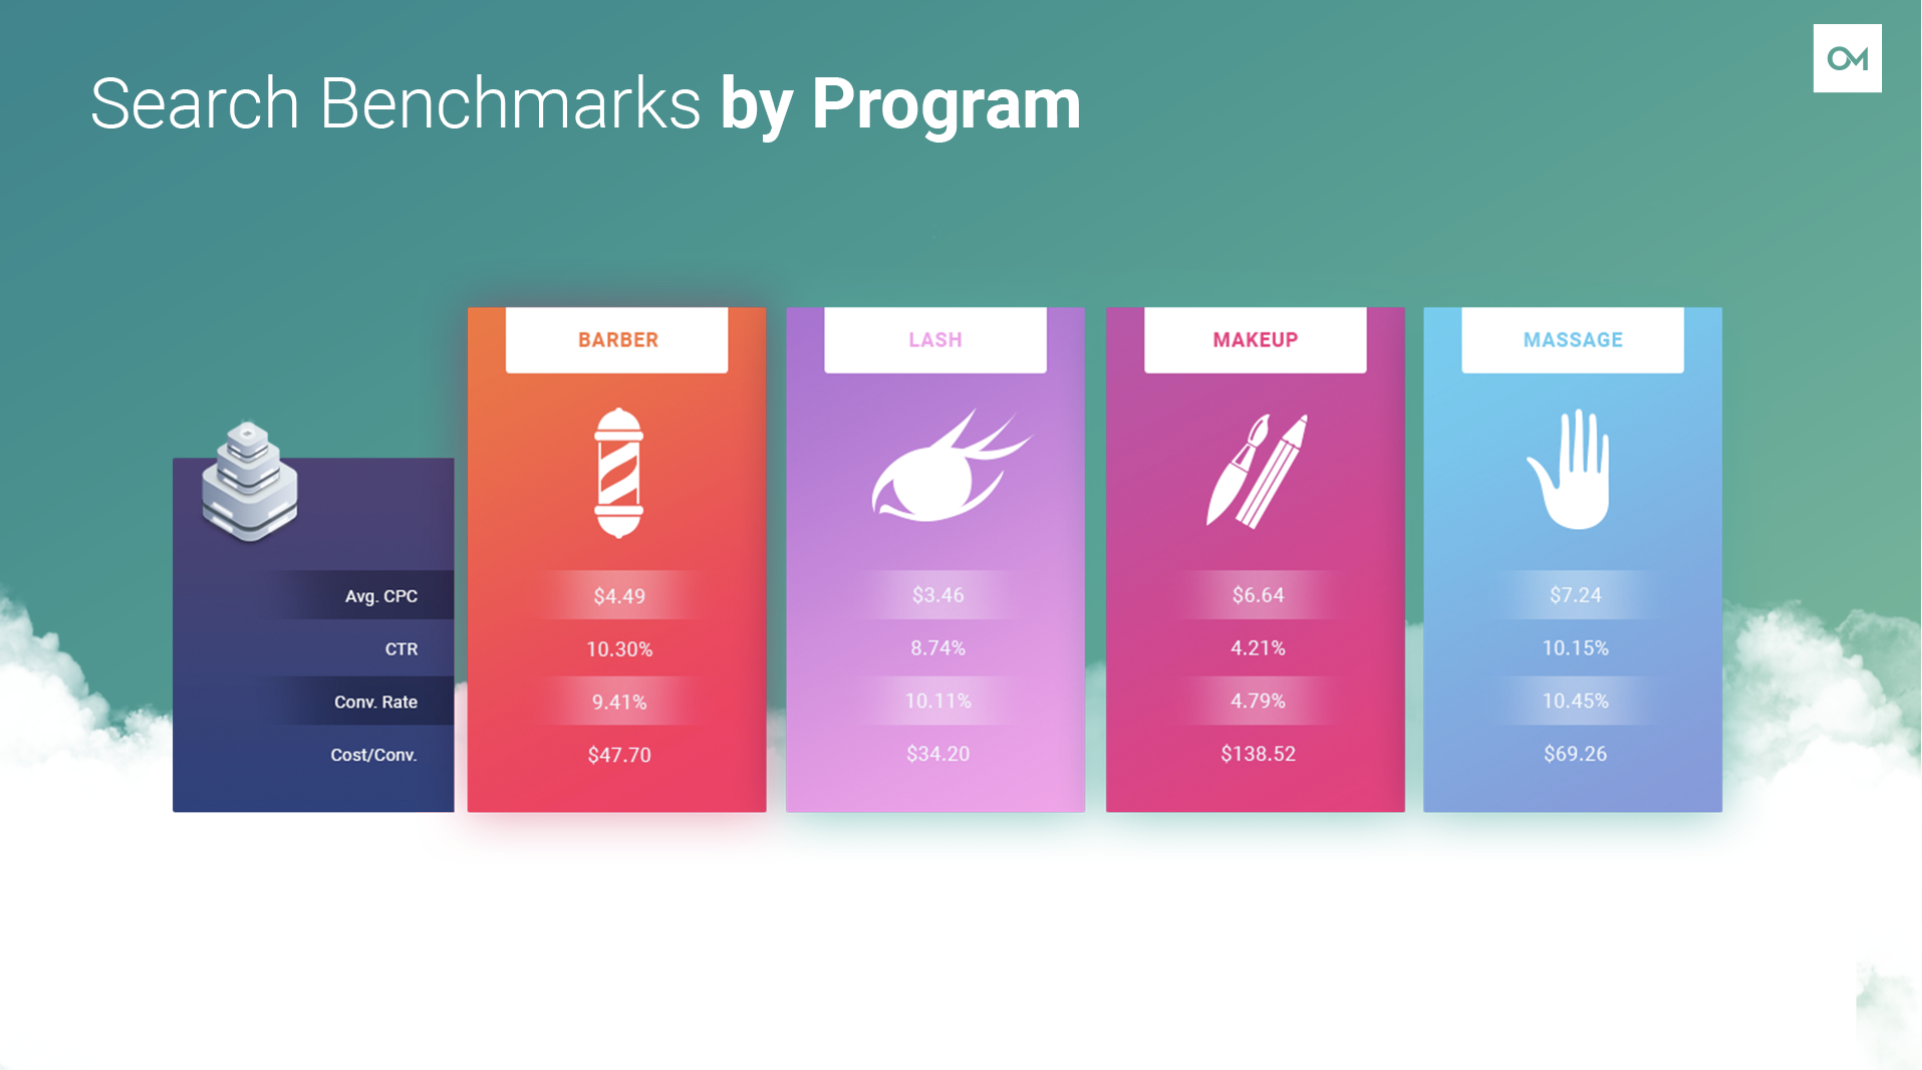
So these campaigns, Barber Lashes, Makeup and Massage are the ones that we have significant data for, but we run them less often than some of our other programs. So we’ve got cosmetology and esthetics we’ll get to in just a moment. But the thing I want to point out with these programs in particular is that the cost per-lead I see having a pretty direct correlation with the program length.
So Lashes for example, is typically a really short program. Sometimes, or in often cases it’s a weekend-long program. So the barrier to a student to enter into that program is really low, therefore you get a pretty low cost per-lead. And then it kind of increases with barbering and massage. I would say that makeup is the outlier here, and that’s because I think we have a lot of clients who are running makeup terms, but for their either cosmetology or esthetics program.
So the little mismatch in terminology there, I think, is what drives the cost per-lead up in that case. But generally speaking, these are the benchmarks for that. If you haven’t taken a screenshot already, now’s your time.
Brand, Cosmetology, and Esthetics Benchmarks
Moving on to cosmetology and esthetics programs, as well as brand. So we get a lot of questions about this, so I want to address it kind of right off the bat, is that’s the difference between the cost per lead in cosmetology versus the cost per lead for esthetics.
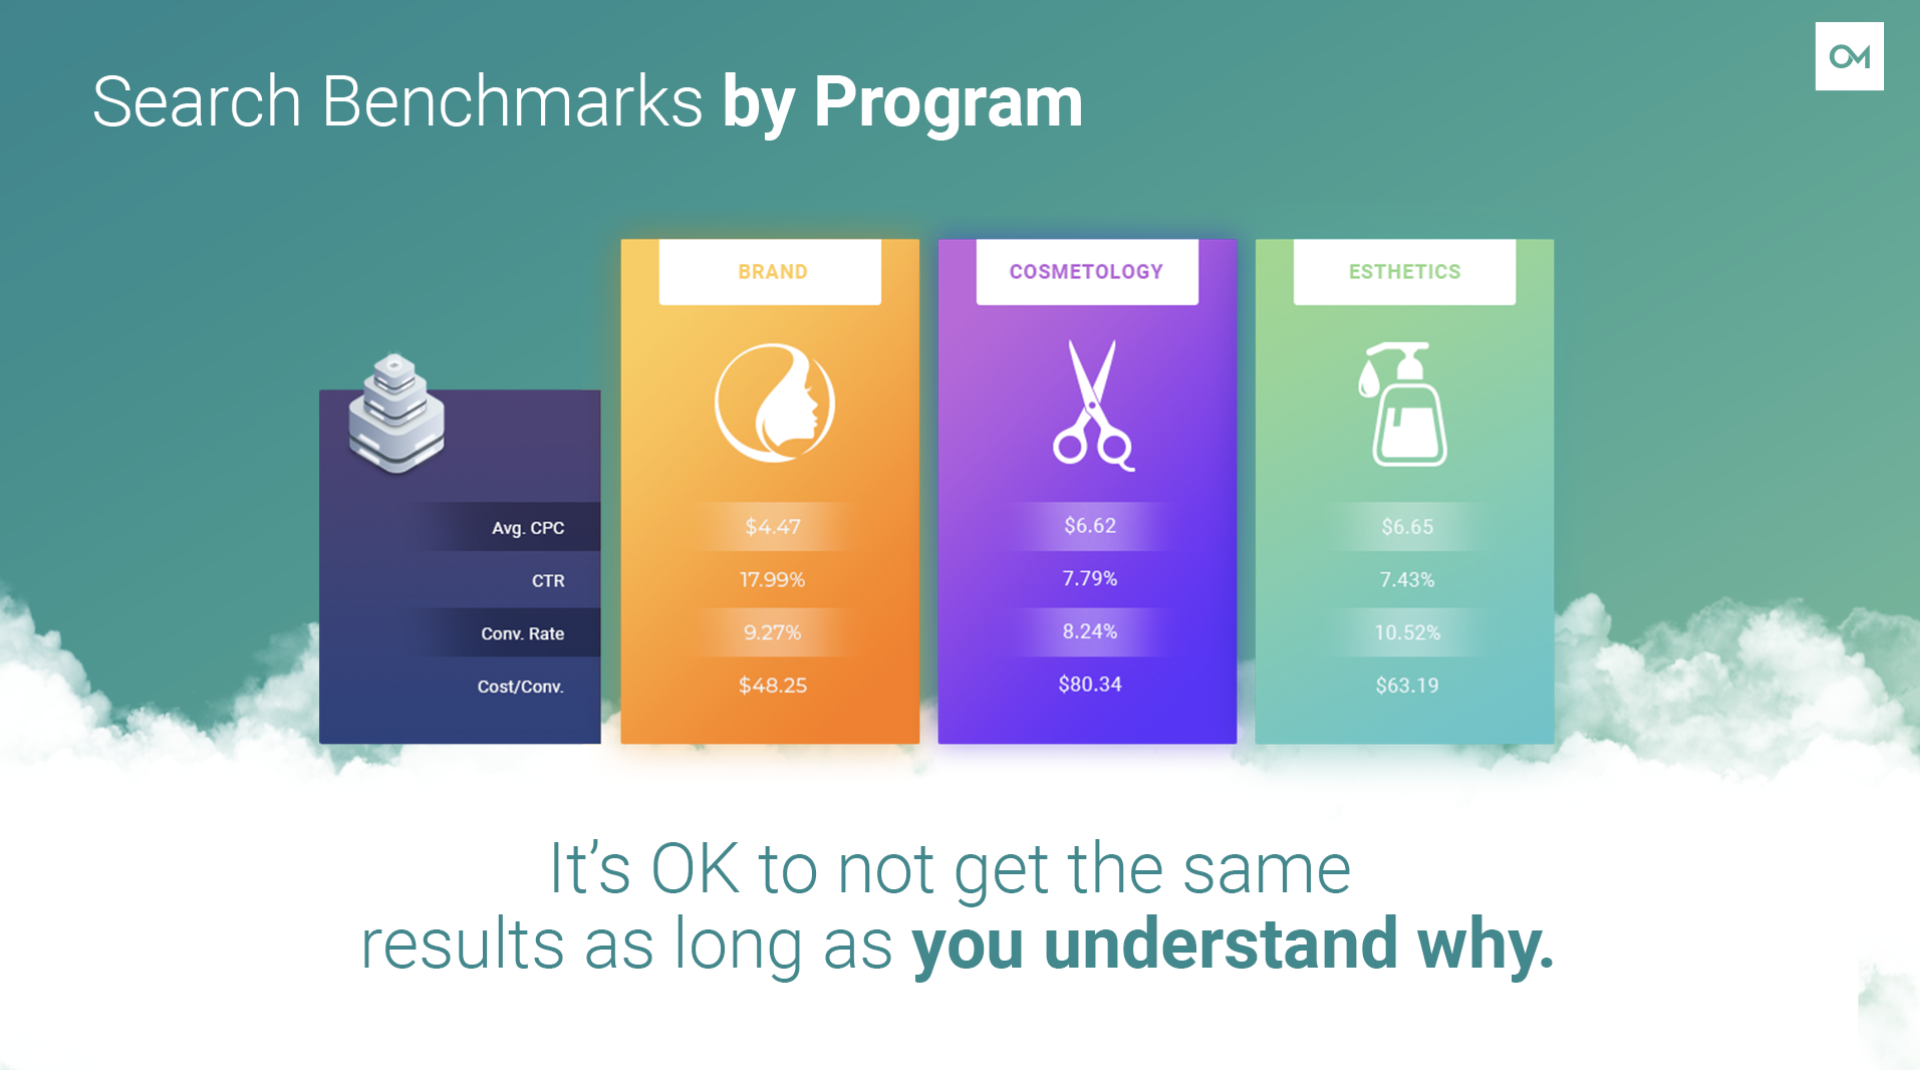
There has always been a difference there. Cosmetology has historically been a longer program. It has typically cost more for the student. And so I think those are the barriers that, like I was mentioning before, lead to that higher cost per-lead. I would say that in recent years, that gap has maybe widened even a little bit. Because as the economy goes, as inflation, you could consider it part of inflation. Our cost per-click, our cost per-lead is steadily increasing year over year. That’s just the way the industry travels.
However, for esthetics, I feel like it’s remained pretty consistent. And I think that’s because at the same time, skincare has gotten kind of more trendy in the market space generally. So there’s a lot of interest that has grown in the esthetics realm. Which I think has, like I said, maybe widened that gap a little bit between the cost per-lead of those two programs.
Third, I put the brand campaign up here as well, so you can see how that performs. This is a pretty standard kind of best practice that we do for a lot of our accounts. The reason for it, there are a lot of reasons for it really. But one of which is it’s going to lead, to or lend to your brand authority.
So if somebody searches your name and they see your organic result on the page as well as a paid result, it’s just going to take up more of that search results page, push any potential competition out of the way, and make sure that there are no distractions for somebody who wants to show up on your website. Another thing is that you might have competitors who are bidding on your name as a keyword. And if you’re doing that yourself, you’re going to win those competitions and basically keep your competitors off your back. You’re going to be able to win those auctions at a much lower cost because you own your domain that has your brand name in it most of the time, your website has your brand name all over it, and that’s the key word. Your ad is going to be able to have your brand name in it.
So everything that Google sees is going to line up much better for you than it is for any competition who’s bidding on that name. So it’s a relatively cheap cost to keep the competition out of the way, so to speak, and sort of protect your brand.
Like I mentioned before, if these results … Oh, quick note, take a screenshot if you haven’t already, if you want to keep this. If you’re looking at these numbers and they don’t look like anything that you’re seeing, like I said, that’s okay as long as we understand why it might be different. So there are a lot of reasons that your performance is going to look different, and I want to get into some of those next.
Why Aren’t You Seeing The Same Results?
What Can’t You Control?
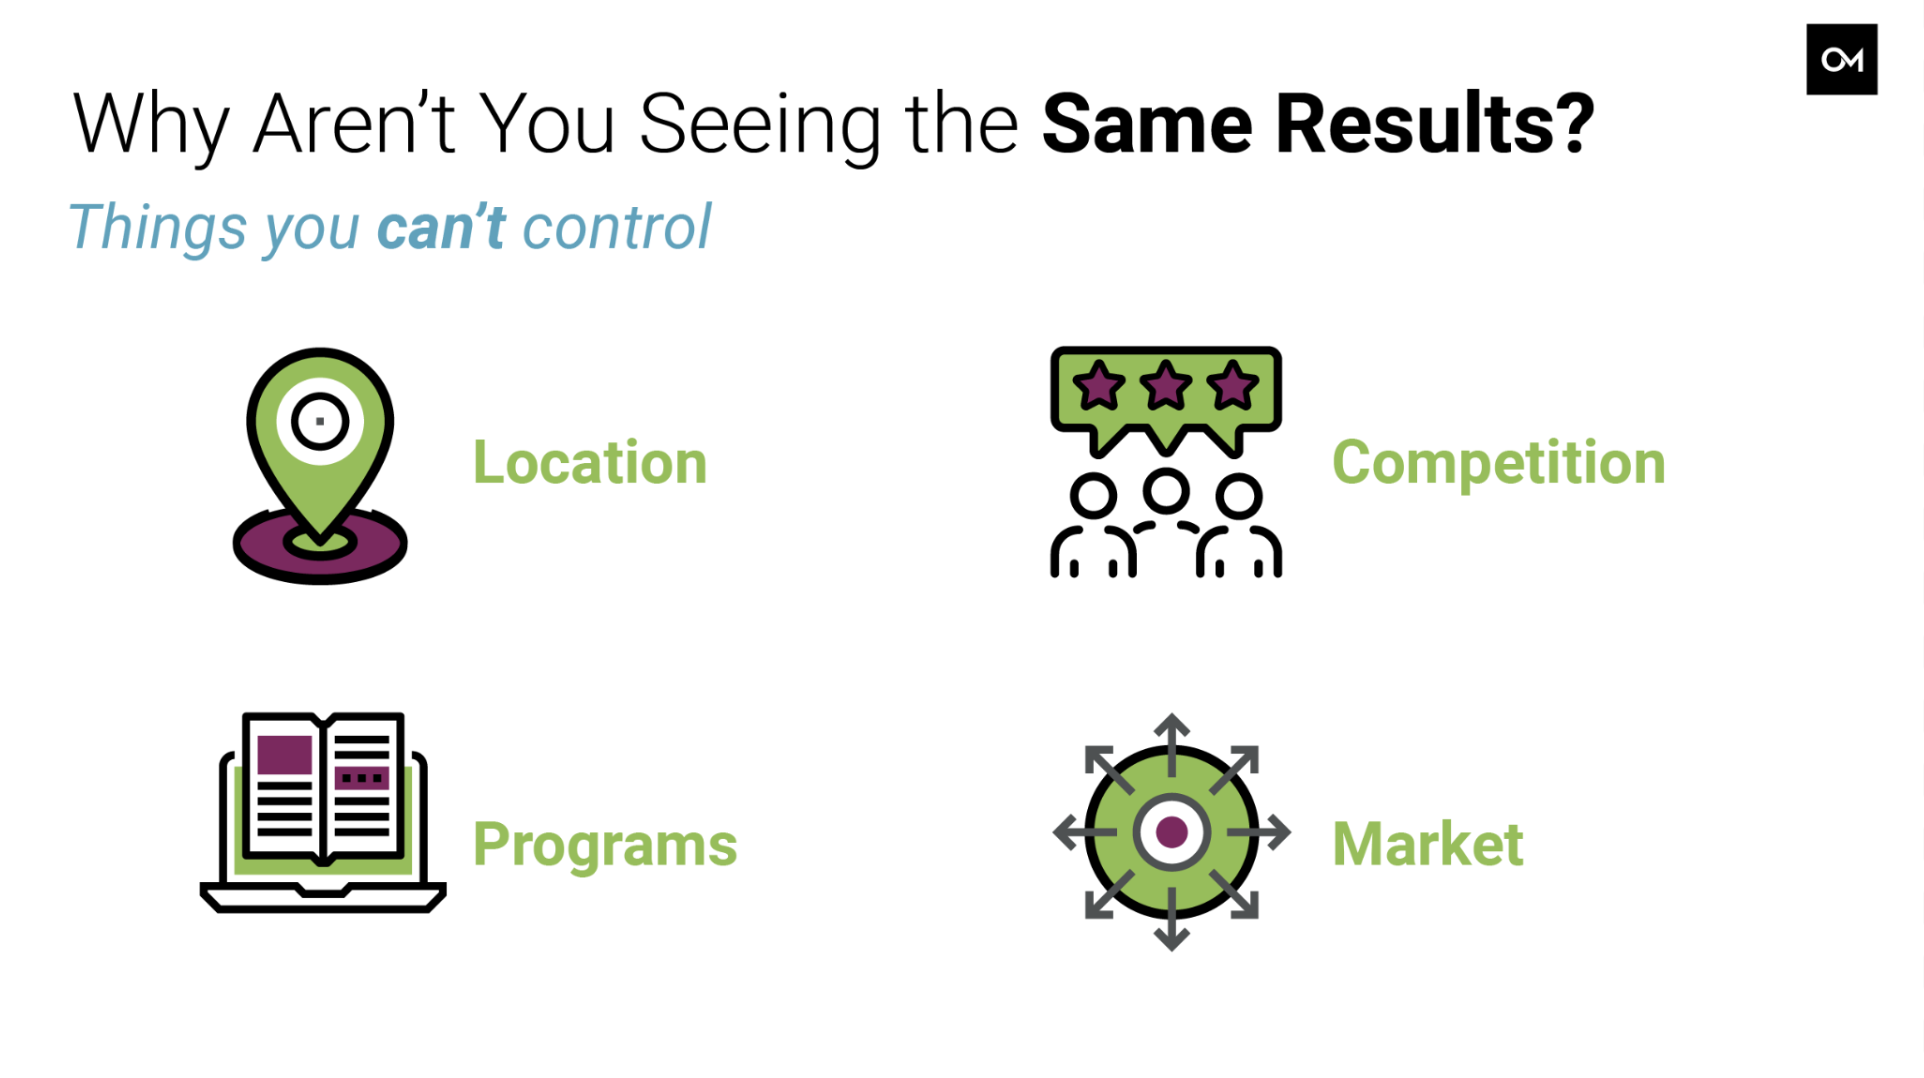
First off, there are some things that you can’t control, at least not within the Google Ads platform. Maybe as the business owner, you can change these things, but it’s kind of a different ballpark. So within the Google Ads platform, you can’t really change the location of your business. So if you’re located in a rural area versus a really populated area, that’s going to have an impact on performance.
The programs that you’re offering, like I said, we just went through the differences that those have, and the competition in your market. So if you’re dealing with dozens of competitors versus just maybe one, that’s going to have an impact on the way things work. Or your market generally, like I mentioned a minute ago, esthetics has been really trendy, skincare has been really trendy. That can vary from location to location, so that’ll have an impact as well.
What Can You Control?
Those are things that you can account for, but you can’t really control. However, there are some things that you can control within the Google Ads platform.
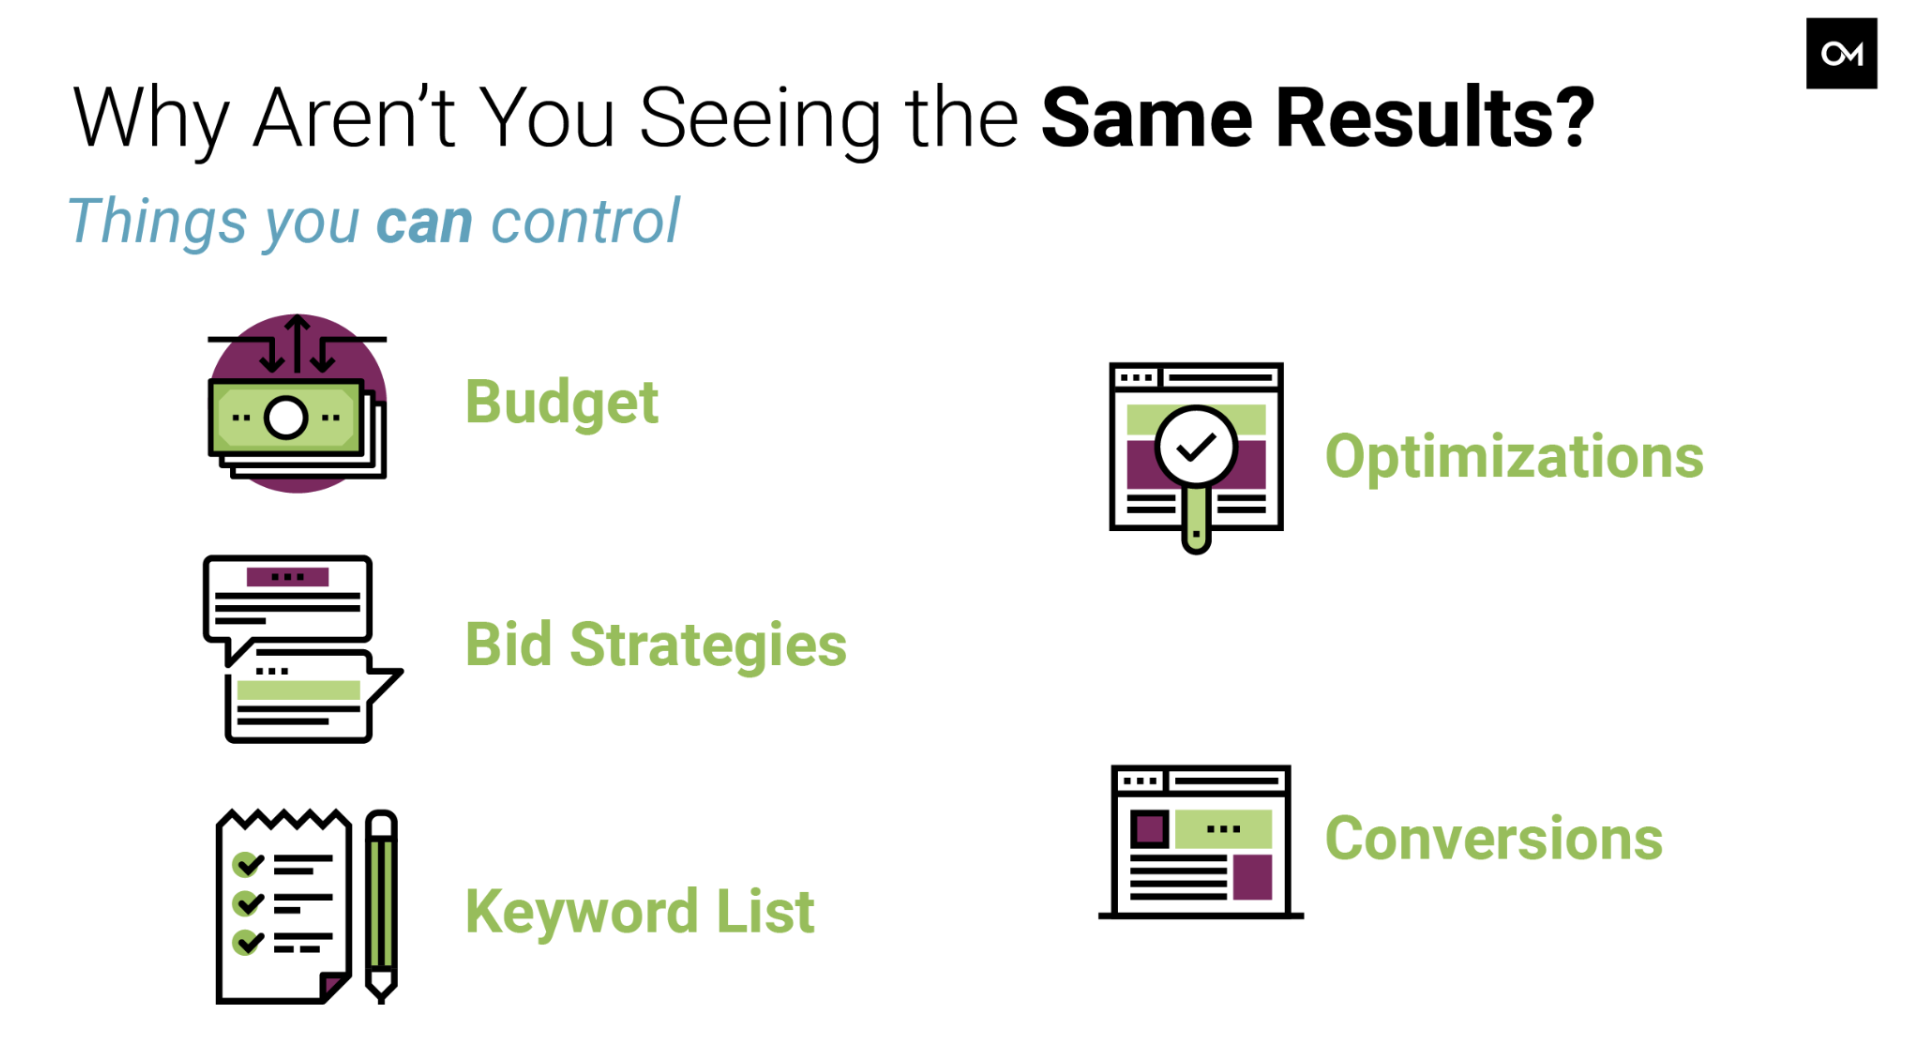
Your budget, for example. We’ve noticed that schools that have sort of smaller budgets tend to get a slightly lower cost per-lead overall, and I think that’s because Google is trying to be as efficient as possible with the budget that you’ve got. So it’s basically getting kind of the lowest hanging fruit conversions.
We’ve noticed that as you increase your budget, your cost per-lead sometimes does increase, which is fine. You kind of are on that curve of diminishing returns. But as long as your cost per-lead is lower than the value that that lead provides, you’re still within a positive ROI, and that’s still okay. You just need to make that decision for your business of where that line is that you’re not willing to cross.
Your bid strategy is going to make a difference as well. If you’re using the wrong bid strategy, it’s going to affect your performance. Your keyword list is going to make a difference. We found that a really relevant yet robust keyword list is kind of the sweet spot for that.
If you’re targeting too many keywords or there are too broad, or if they’re too narrow, they’re going to see a differences in performance, and it honestly could go either way.
The other optimizations that you can make within the platform, so this is using all of the different assets that you can, location extensions, phone call extensions, your call-outs, and your site links, all of those optimizations that you can make. Images, add creative, et cetera, those are all going to affect your performance as well.
And then lastly, this is kind of the one that I think is maybe the most important, is what you’re tracking as a conversion. So what we’re considering a conversion is a pixel fire that’s based on someone who fills out the lead form, and then clicks on the submit button.
There are a lot of different ways that you can track that, but that’s what we found to be the most relevant. And we only track one form fill per-person. You could, in theory, get someone who fills out the contact us page, and the barbering page, and the cosmetology page. But that’s only one person, it’s only one lead. We only count it one time. So if you’re counting something different as your conversions, that’s also going to be a major reason why you’re seeing different performance metrics than us, or different results.
So I would say just pro-tip, be really careful about what you’re counting as a conversion. Because that’s going to set the foundation for all of the optimizations that you can make in your account moving forward. I recommend making it as accurate and relevant as possible to get the best results there.
Landing Pages
So there’s one other thing that I think makes a really big difference to your paid ads performance, and that is your landing pages. So I wanted to include this as well as part of the industry benchmarks.
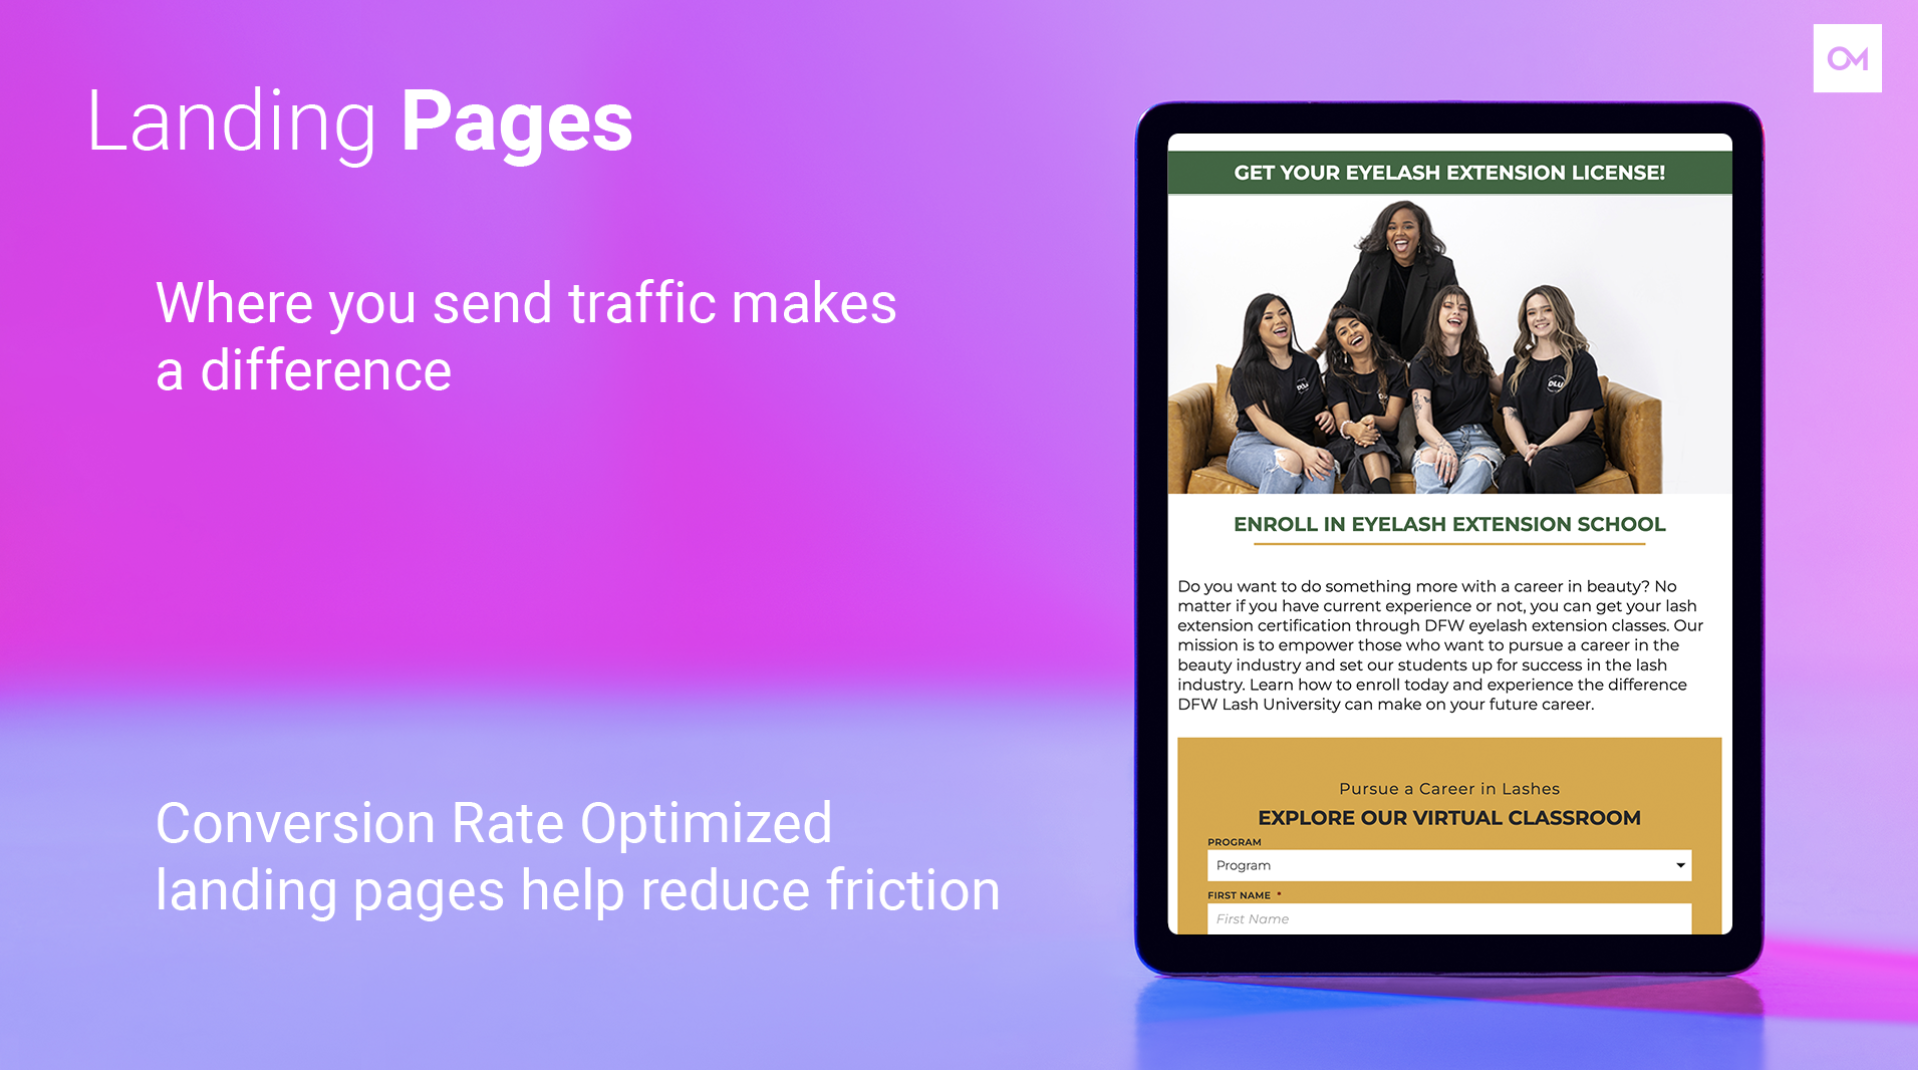
So where you send traffic makes a huge difference. Landing pages are generally optimized for conversion rates. They reduce friction for the user, they make it really clear what the user is supposed to do once they get there, whether that’s to call a phone number to fill out a form. It’s very specific on the page of what they need to do, and that’s that leads to an increased rate of conversions.
Let’s Look at The Data
So yeah, we’ll just jump into the data, I guess. What we found, I pulled the data for all of the UZL landing pages that we run traffic to versus any other place, basically, on average.
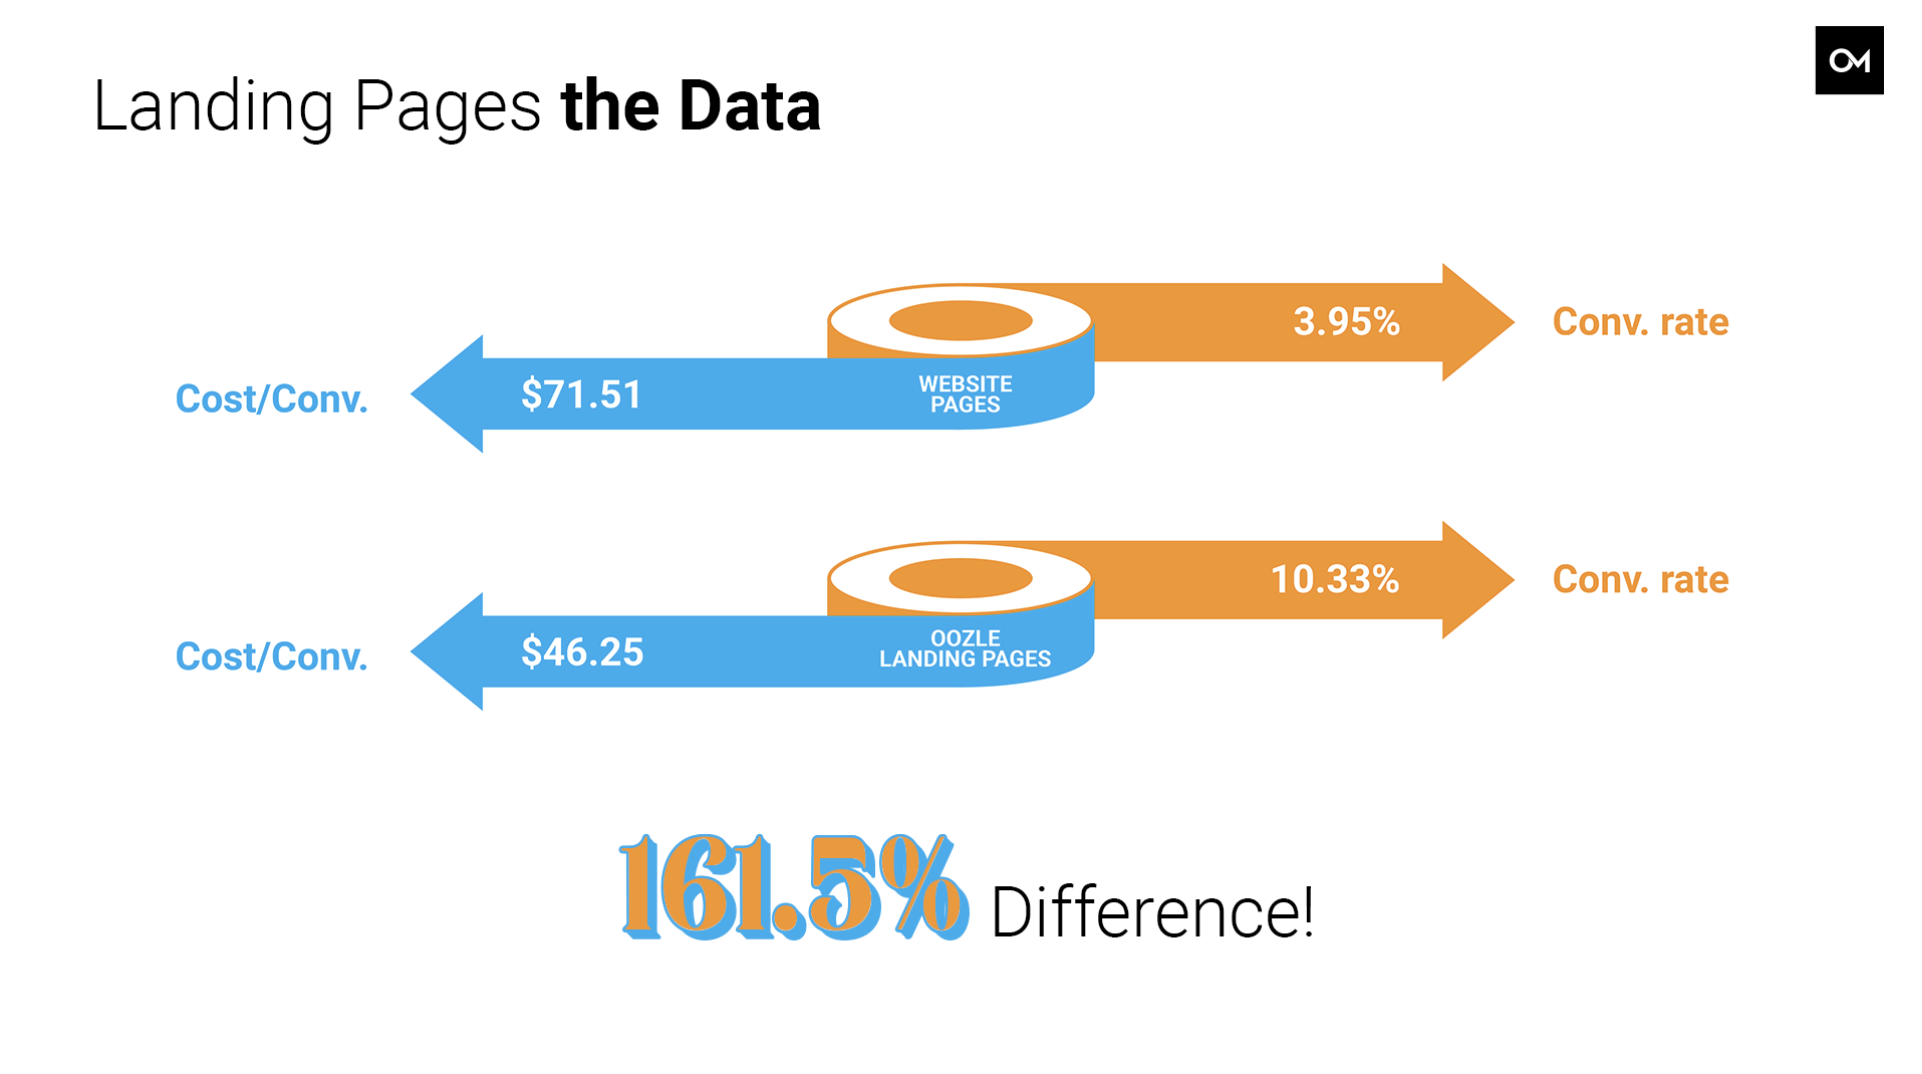
So any website page, program page, homepage, whatever it might be on your website, versus a dedicated landing page. And the results are pretty insane. It’s 161 and-a-half percent increase of your conversion rate, if you’re running to a landing page. And subsequently a much lower cost per-conversion.
So imagine if you’ve got a fixed ad budget, and you’re sending all this traffic to your homepage or to a program page, and you’re getting around a 4% conversion rate. And then you were to switch that same traffic to a landing page, you’re going to increase your conversions by a very wide margin. And you’re going to see that difference in your cost per-lead, and you’re going to see that when your phone is ringing in your admissions office. So huge kind of highlight or plug for landing pages here, they make a massive difference.
There’s a little anecdote I’ve got as well. We had one client who was maybe a little bit less than stoked on their landing page performance, and they decided they wanted to try running ads to their website, their program page on their website.
So we did that. We ran an AB test, we experimented between the two. And we found that in this case, the website actually did win out a little bit. The performance increased or improved a little bit when we switched from the landing page to the website. Side note, this was a website that Oozle built.
But that was unusual for us. So we decided to take a look at the elements of the webpage that maybe were different than the landing page, and applied those differences that happened to be, I think, the content that was on the page. We applied those differences to the landing page, updated the landing page, and decided to run the test again.
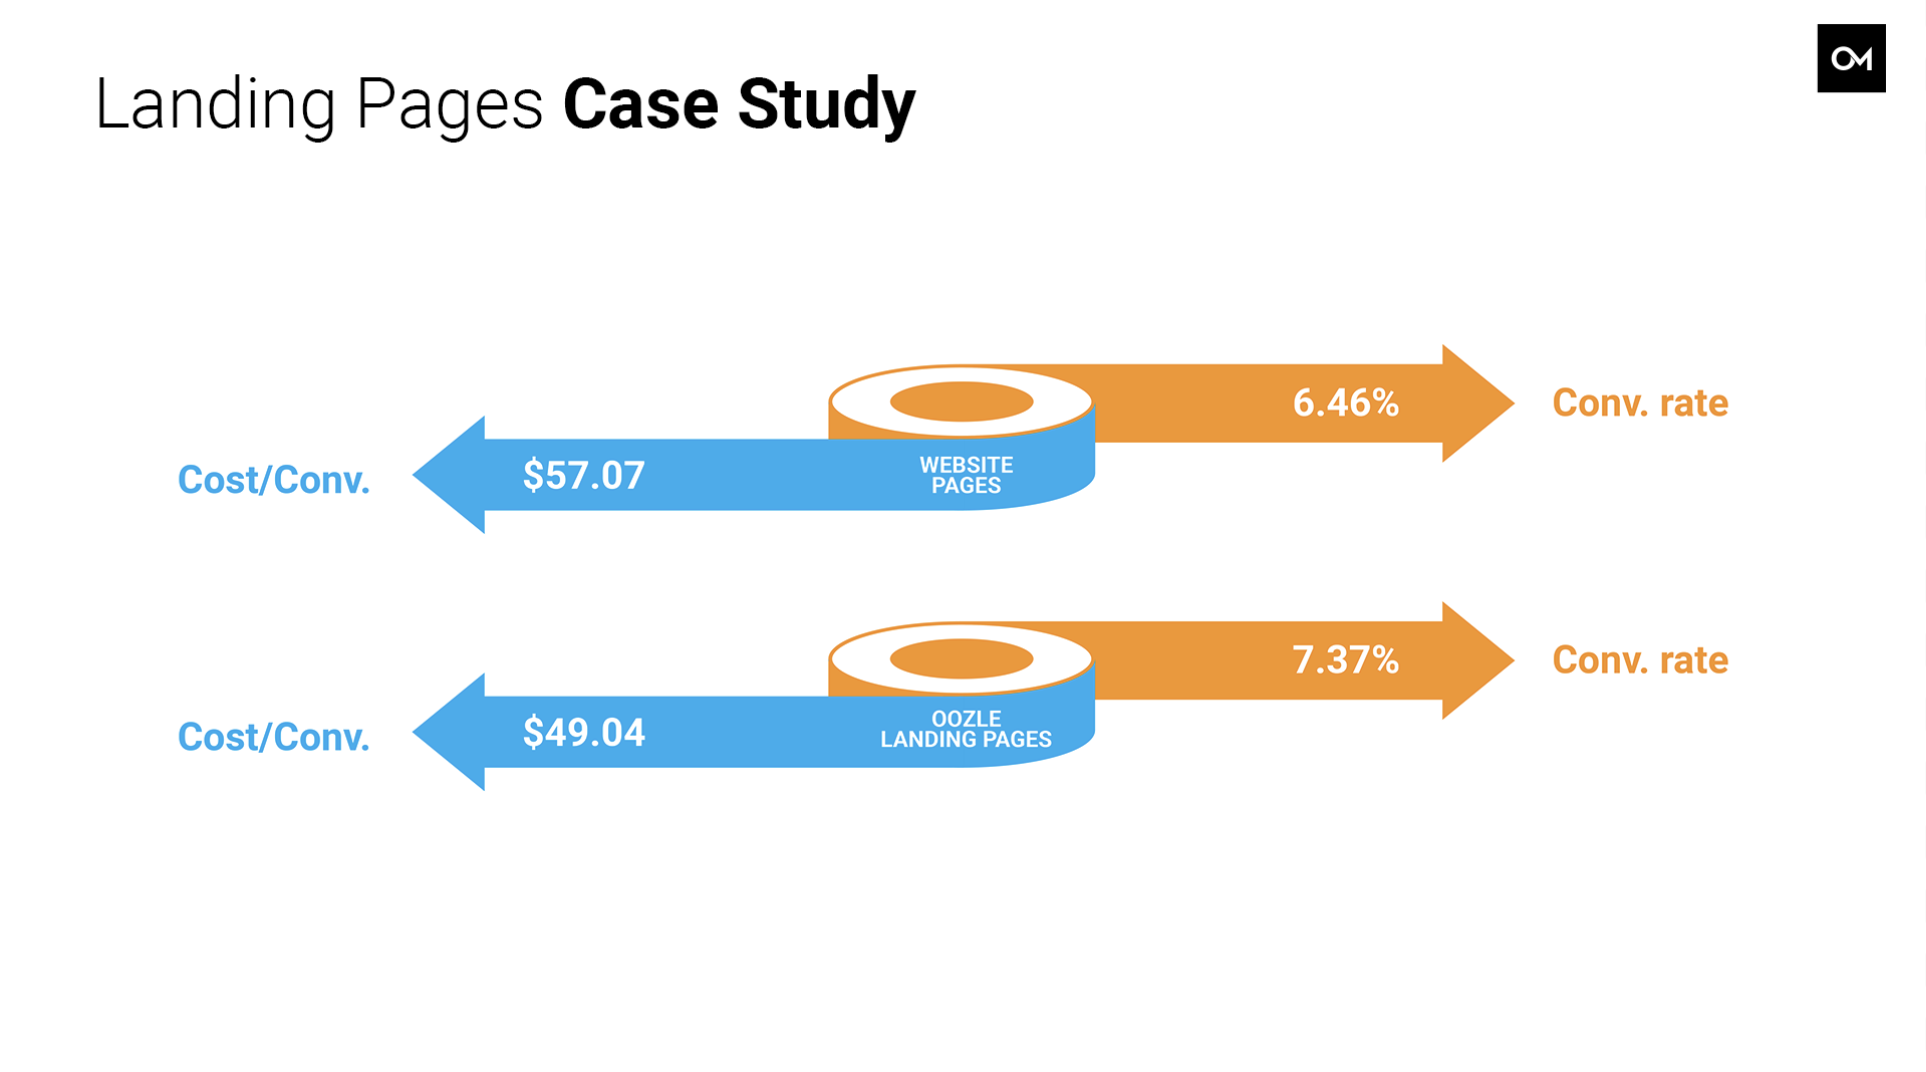
So this is the second time. They’ve already improved performance once, and then we split it again and found after that experiment ran for a little while that the performance improved again. And that’s what this is showing here.
So this is from the website back to the landing page the second time. So remember, this is already improved once after sending it to the website, and then sending it back to the landing page improved again from the cost per-conversion, around $60 to just under 50, and a conversion rate from about six-and-a-half percent to over 7%.
So marginal differences, yes. But it kind of is, again, another highlight or shout out to continually be testing, continual experimentation, and maybe a little bit of a plug for working with an agency that specializes in this industry, right? Because we were able to take the learnings that we had from this experiment and apply it to our landing page template moving forward, so that all of the clients that are getting landing pages from us now have that additional learning in that landing page. So kind of a cool thing here, that we were able to learn from this little case study, and the importance of landing pages generally.
So yeah, that’s pretty much it from me. Here’s this first slide again if you didn’t catch a screenshot of it, feel free to do that now. And here’s my email at the bottom. If you want to talk about your performance, if it doesn’t look anything like this or if it looks maybe close but you want to know why it’s not feeling the same, feel free to email me. I’m happy to talk about it. Happy to dig in and go over what those differences are.
So again, thank you for your attention. Thank you for participating in this presentation today. And yeah, that’s it for me.
Need Help With Your Google Ads? Contact Dave!
Chris Linford:
Hey, Dave, stick around for a second. We got a question. Landing pages versus website pages. What’s the difference?
David Steiner:
Yeah, so landing pages typically are built sort of as separate from your website. They’re not something that you can necessarily navigate to from your website. And oftentimes, they don’t have a navigation bar at the top. They don’t really have any distractions, is kind of how I like to think about it. So they’re reducing friction for the user who gets to that page, they have exactly the content that they’re looking for because it’s related to the keyword and the ad that they clicked on.
And then the call to action, whether that’s to fill out a form or to phone a number is very, very clear, and very prominent on that page. It’s usually, we call it above the fold. We’re going to have a presentation a little bit later today that talks about conversion rate optimization and websites, It’s also applicable to landing pages. So there’s going to be some good info in that as well. But yeah, those landing pages just make, they streamline the process for folks who want to fill out a form, basically.
Chris Linford:
Got it. And just to add to that, your landing page isn’t going to look like your normal website, where you can see the menu at the top. It’s you get on there, you can either become a lead or leave the page.
David Steiner:
Right. Yep.
Chris Linford:
Okay. Steiner, awesome stuff. We really appreciate you, and the team, and just these great results. And I mean, it’s just nice to know if you’re a school, hey, how do I compare with other schools? So this is really good data. Thank you so much.
David Steiner:
Awesome. Yeah, you bet.